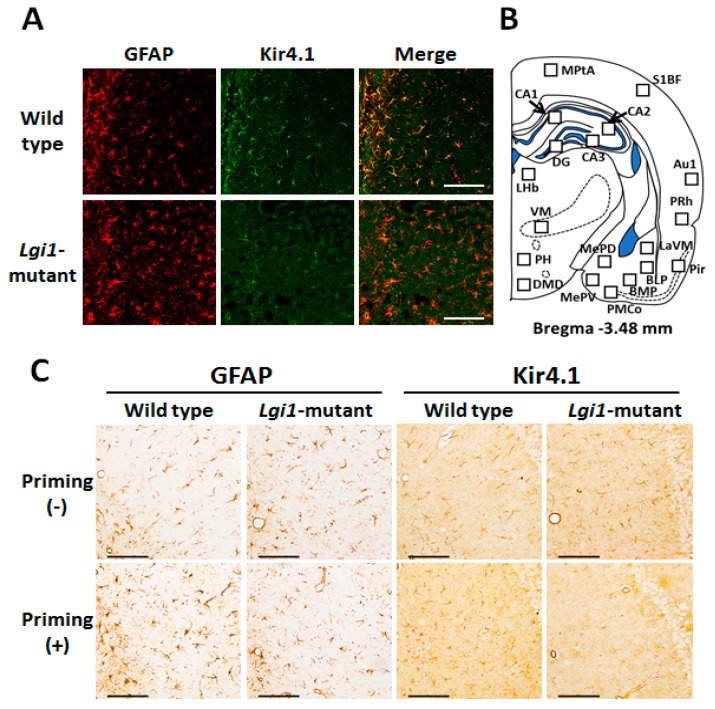
Figure 2.
Kir4.1 expression in astrocytes. (A) Representative images of immunofluorescence double staining for glial fibrillary acidic protein (GFAP) and Kir4.1 in the hippocampal CA1 region in wild-type F344 rats (top panels) and Lgi1 mutant rats (bottom panels). Scale bar: 100 μm. (B) Schematic illustration of a brain section (Bregma −3.48 mm level) selected for quantitative analysis of immunoreactivity (IR) of Kir4.1 or GFAP. Squares in each brain region indicate the areas analyzed for counting of Kir4.1-IR-positive or GFAP-IR-positive cells. Medial parietal association cortex (MPtA), primary somatosensory cortex barrel field (S1BF), primary auditory cortex (Au1), perirhinal cortex (PRh), piriform cortex (Pir), hippocampal CA1, CA2, CA3, and dentate gyrus (DG), medial amygdaloid nucleus posteroventral part (MePV), medial amygdaloid nucleus posterodorsal part (MePD), posteromedial cortical amygdaloid nucleus (PMCo), basomedial amygdaloid nucleus posterior part (BMP), basolateral amygdaloid nucleus posterior part (BLP), lateral amygdaloid nucleus ventromedial part (LaVM), lateral habenula (LHb), ventromedial thalamus (VM), posterior hypothalamus (PH), dorsomedial hypothalamic nucleus, and dorsal part (DMD). (C) Representative images of immunohistochemical staining for GFAP and Kir4.1 in the hippocampal CA1 regions of non-primed wild type rats (upper left panels), primed wild type rats (lower left panels), non-primed Lgi1 mutant rats (upper right panels), and primed Lgi1 mutant rats (lower right panels) after audiogenic seizure induction. Scale bar: 100 μm.

