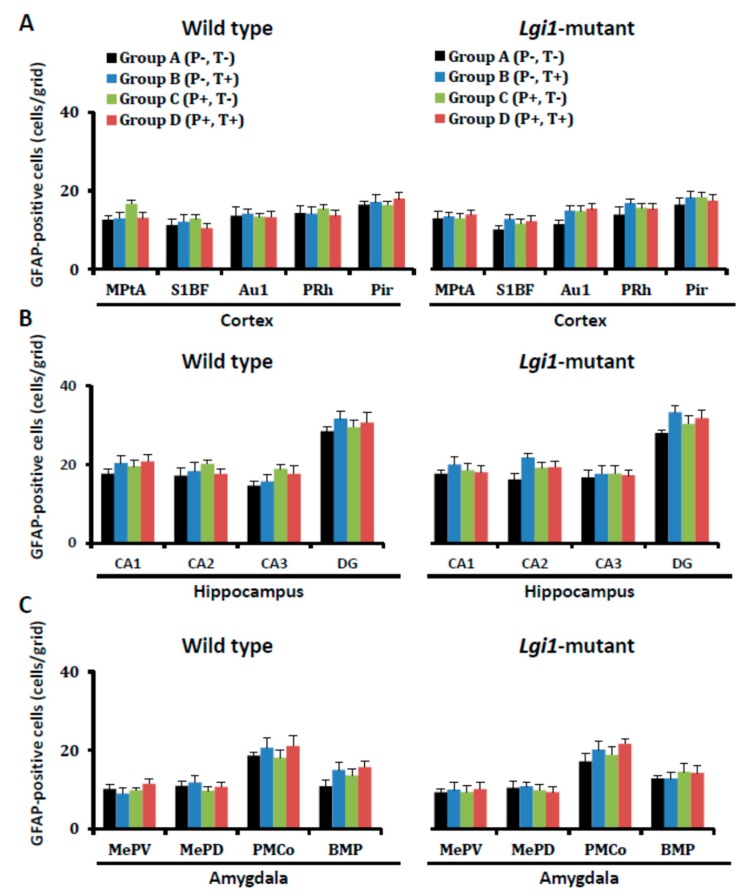
Figure 3.
Changes in the number of GFAP-immunoreactivity (IR)-positive cells after development of audiogenic epilepsy. The GFAP-IR-positive cells in each group of wild-type rats (A–D) and Lgi1 mutant rats are shown in each region of the cortex (A), hippocampus (B), and amygdala (C). Each point represents the mean ± S.E.M. of six to eight animals.

