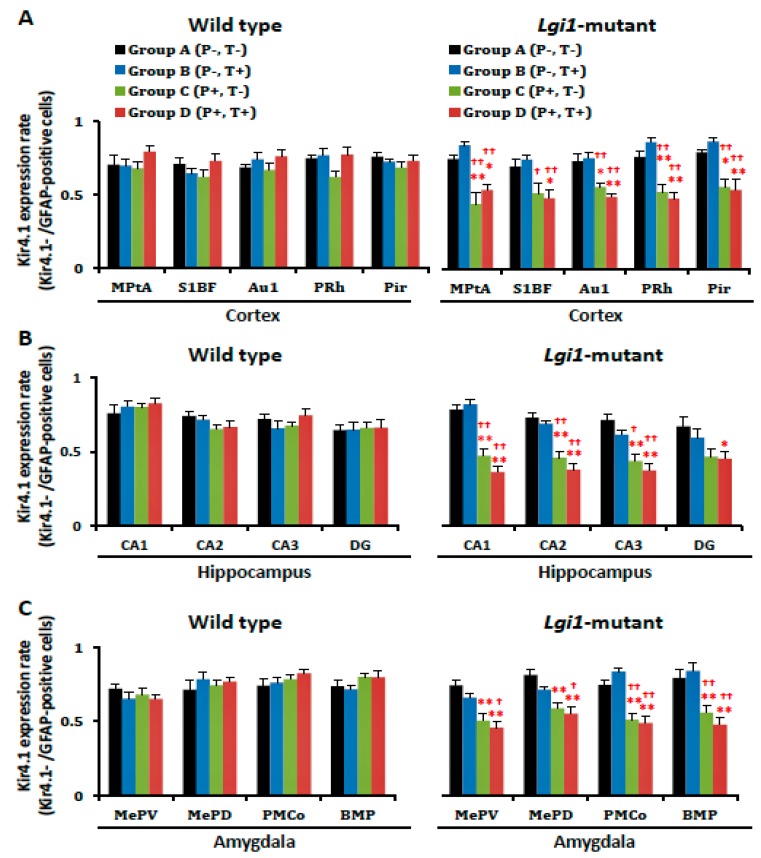
Figure 5.
Changes in astrocytic Kir4.1 expression after the development of audiogenic epilepsy. The Kir4.1 expression rate in each group of wild-type rats (A–D) and Lgi1 mutant rats are shown in each region of the cortex (A), hippocampus (B), and amygdala (C). The Kir4.1 expression rate was expressed as the ration of Kir4.1-immunoreactivity (IR)-positive cells to GFAP-IR-positive cells in each region by staining a pair of successive brain sections with anti-Kir4.1 or anti-GFAP antibodies. Each point represents the mean ± S.E.M. of six to eight animals. * p < 0.05, ** p < 0.01, significantly different from Group A of wild-type rats and Lgi1 mutant rats. † p < 0.05, †† p < 0.01, significantly different from Group B of wild-type rats and Lgi1 mutant rats.

