Figure 1.
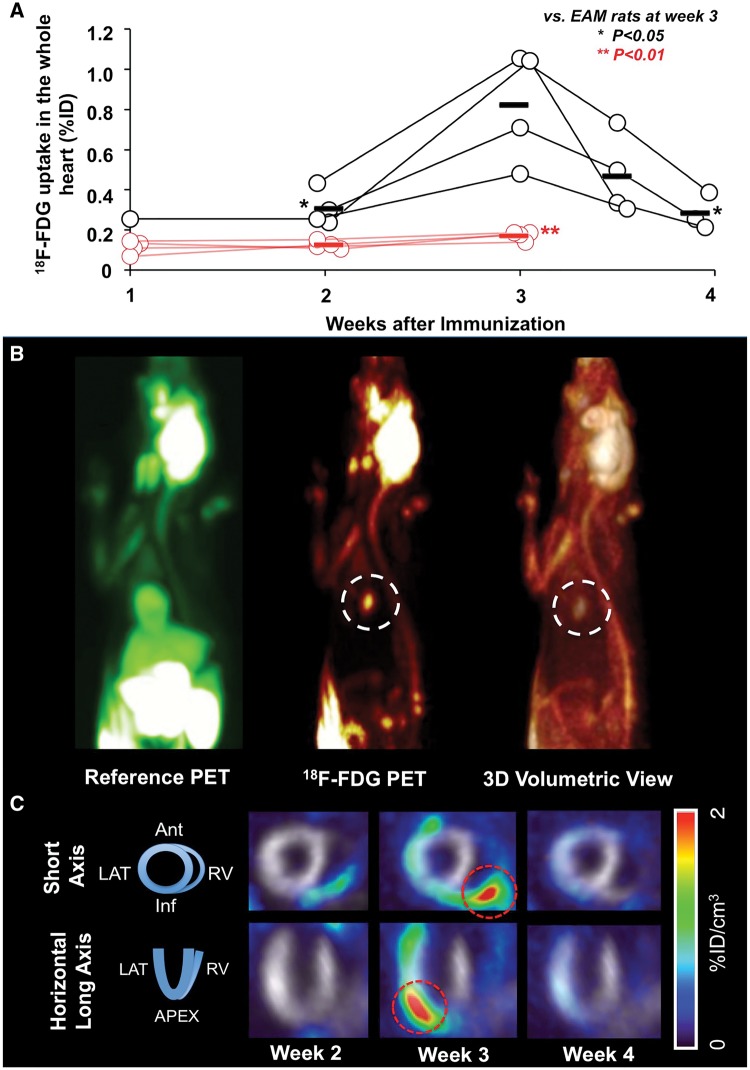
Longitudinal 18F-FDG PET imaging. (A) Total 18F-FDG uptake by PET given at week 1, 2, 3, 3.5, and 4. Uptake peaked at week 3, whereas a decrease could already be visualized at week 3.5. A good discrimination compared with controls could be observed. (B) In vivo PET imaging 3 weeks after immunization (acute phase). Myocardial reference PET (18F-FDG under insulin stimulation, left), 18F-FDG PET (middle) and 3D volume rendering view (right). Clear focal 18F-FDG uptake signal in the heart can be observed (white dotted circles). (C) Serial 18F-FDG imaging 2, 3, and 4 weeks after immunization with representative short-axis and horizontal long-axis PET images of a myocarditis rat. Inflammation indicated by 18F-FDG starts at the right ventricle (week 2), whereas at week 3, the global heart is affected (red dotted circles). Grayscale images served as a myocardial reference. EAM, experimental autoimmune myocarditis.

