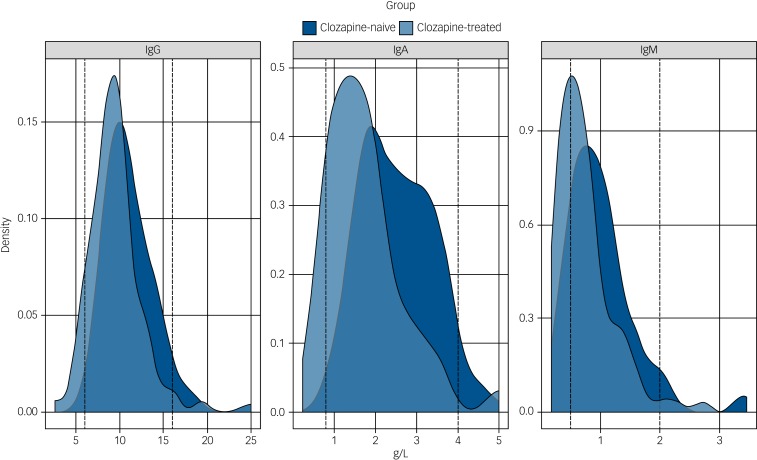
Fig. 1.
Immunoglobulin levels in the clozapine-treated and clozapine-naive groups.
The distribution of the serum levels of immunoglobulin (Ig)G, IgA and IgM for the clozapine-treated (light blue, n = 94) and clozapine-naive (dark blue, n = 98) groups are shown with the laboratory 5th and 95th percentile of the reference ranges for a healthy adult population represented as vertical dotted lines. The differences between the median IgG, IgA and IgM levels for the clozapine-treated versus clozapine-naive groups are all significant (P < 0.0001).

