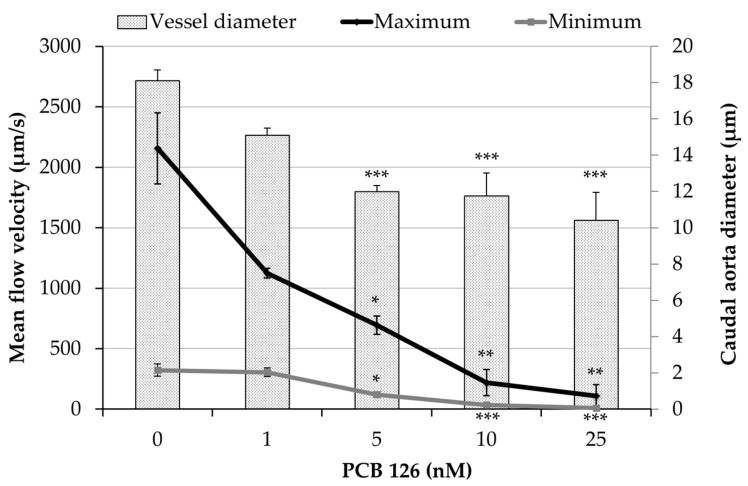
Figure 2.
Effects of PCB126 on peripheral blood flow. Maximum and minimum caudal aortic flow velocity after exposure of embryos to PCB126. Vessel diameter plotted on secondary axis. Values are mean ± SEM (n = 6 larvae). Asterisks represent statistical significance at * p < 0.05, ** p < 0.01, and *** p < 0.001.

