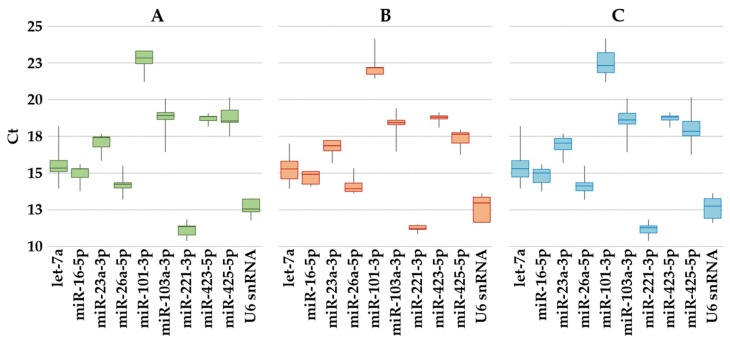
Figure 2.
Expression of candidate reference genes in ASC-EVs. The box plot graphs of the Ct values for each reference gene illustrate the interquartile range (box) and median. The whisker plot depicts the range of the values. (A) ASC without priming; (B) ASC after inflammatory stimuli; (C) All the studied samples.

