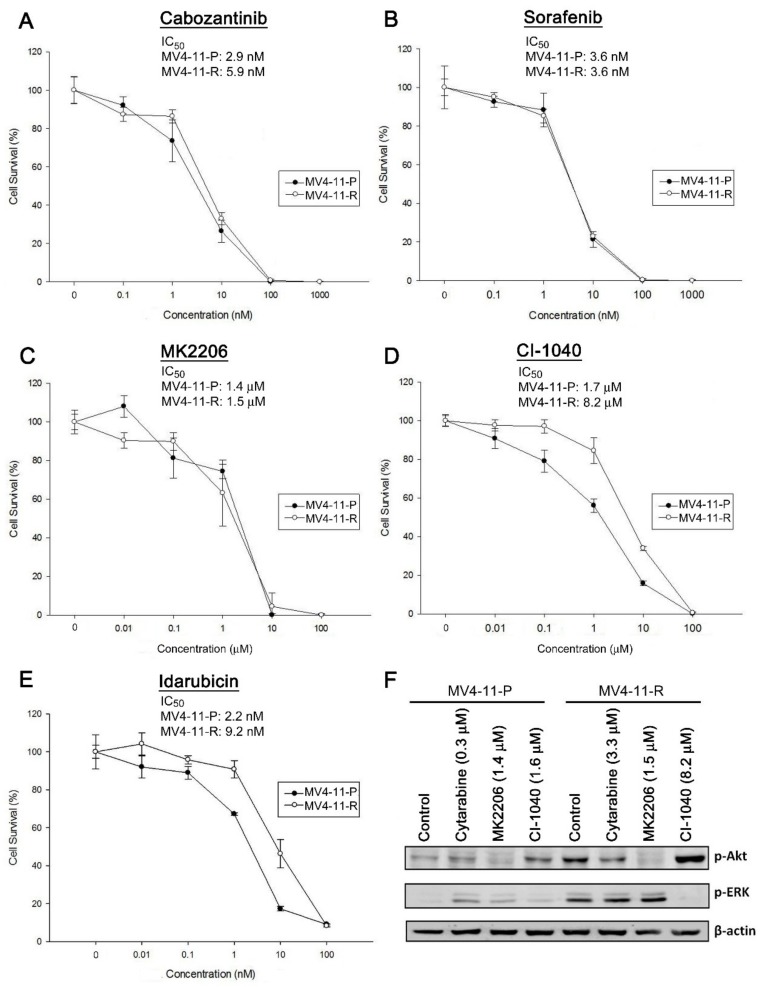
Figure 6.
(A–E) Cytotoxicity curves and IC50 values of anti-cancer drugs for MV4-11-P and MV4-11-R were evaluated by MTS assays. Data are representative of at least two independent experiments each performed in triplicate. Cells were drug-treated for 72 h before performing the MTS assay. (F) Phosphorylation of Akt and ERK in response to drug treatment in MV4-11-P and MV4-11-R was detected by Western blot analysis. Cells were treated with cytarabine, MK2206, or CI-1040 for 6 h before collection of cell lysates. DMSO (0.01%) served as a control. Representative Western blots of two independent experiments with similar results were shown.

