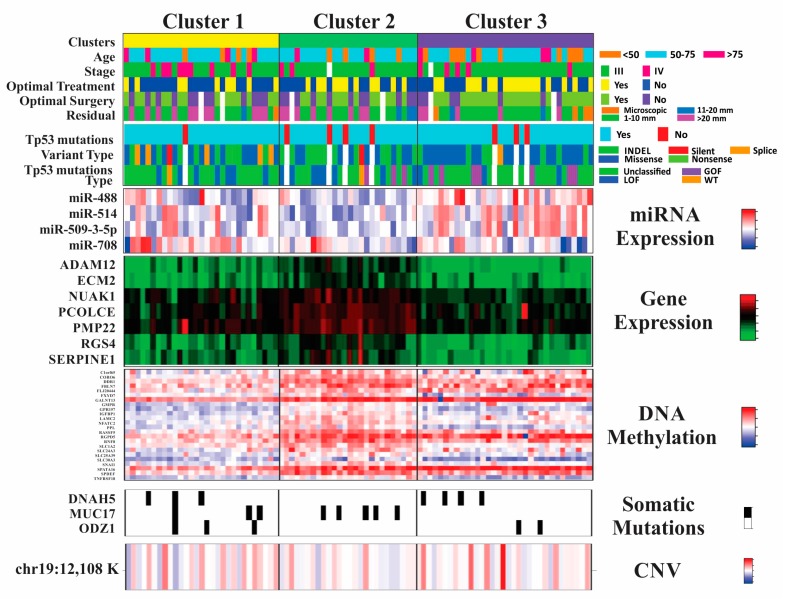
Figure 3.
Clinical-molecular characteristics of the three clusters. At the top are the different clusters: 1 in yellow, 2 in green, 3 in purple. Below them are the clinical profiles with the variable in the left margin (age, stage, optimal treatment, optimal surgery and residual disease after surgery) and the color-code for each category in the right margin. Underneath clinical information there is a representation of TP53 somatic mutation features: presence or status, variant, and mutation type. The last five heatmaps represent the top molecular features with specific color codes for their respective values at the right margin. Only molecular features that were most discriminating for this three-cluster model and passed a selection with a threshold value of > 95th percentile were included in the representation of the final 3-cluster model. Names of all features are detailed in Appendix A.

