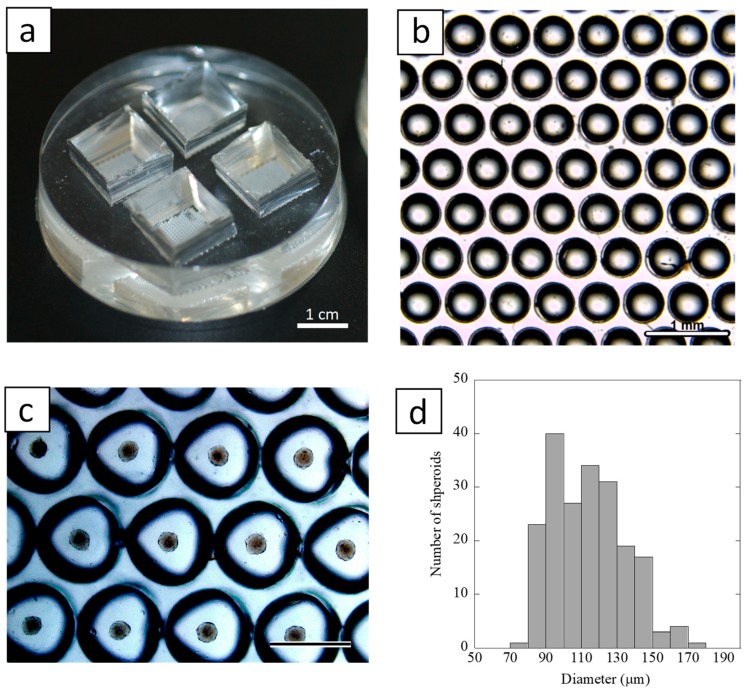
Figure 3.
(a) A photograph of the spheroid culture chip. Bar = 1 cm. (b) Stereo microscopic image of the surface structure of the chip. Bar = 1 mm. (c) A light-microscopic image of spheroid formation on the spheroid culture chip at day 2. Bar = 500 μm. (d) Histogram of size distribution of spheroids formed on the culture chip at day 2 (n = 336).

