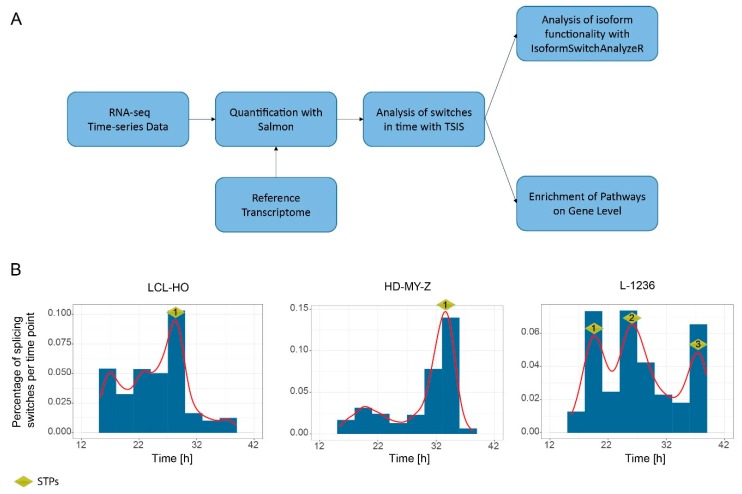
Figure 1.
Analysis of isoform expression switching over time shows an enrichment of switching events in a time-specific manner (A) Schematic representation of the pipeline for the detection and analysis of isoform switching events. (B) Distribution of isoform-switching events for all genes over time. The LCL-HO cell line shows only one switch time peak (STP) between 27 h and 30 h ( STP1, 273 switching events), the HD-MY-Z cell line shows a STP between 33 h and 36 h (STP1, 783 switching events) and the L-1236 cell line shows three STPs between 18 h to 21 h (STP1, 166 switching events), 24 h to 27 h (STP2, 167 switching events) and 36 h to 39 h (STP3, 148 switching events).

