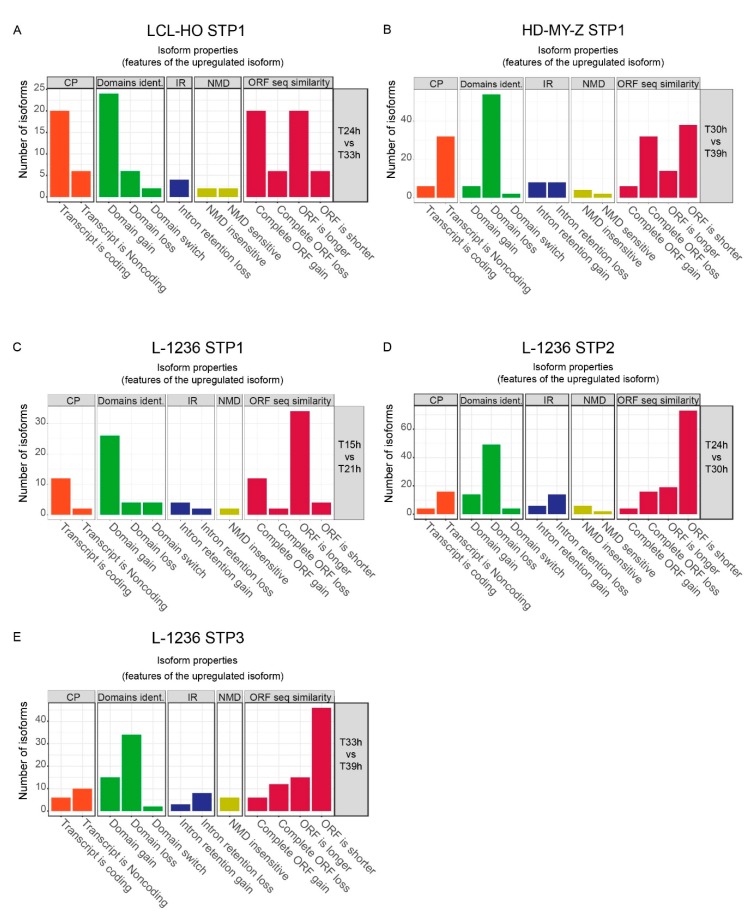
Figure 2.
Computational analysis of the isoforms involved in the STPs shows that the loss of coding functionality and potential domain loss are the main consequences of changes in isoform expression. We performed a computational analysis only on the highly expressed genes and isoforms with changing expression in each STP. The analysis included coding potential (CP), identification of potential domains (domains ident.), possible intron retention (IR), nonsense-mediated decay (NMD) and open reading frame (ORF) length and availability (ORF seq similarity). (A) The STP between 27 h and 30 h for the LCL-HO cell line shows an increase in coding transcripts for the upregulated isoforms leading to gains in potential domains and increase of ORF length. (B) The STP between 33 h and 36 h for HD-MY-Z shows an increase of non-coding transcripts and a related loss of potential domains. The shorter ORF or its complete loss means that sequence elements coding for potential domains are lost. (C) The STP at 18 h to 21 h for the L-1236 cell line shows an increase in coding transcripts for the upregulated isoforms leading to gains in potential domains, and increase of ORF length. (D,E) The STPs at 24 h to 27 h and 36 h to 39 h (respectively) for the L-1236 cell line show an increase of non-coding transcripts and a related loss of potential domains with an increase in both complete ORF loss and shorter ORFs.

