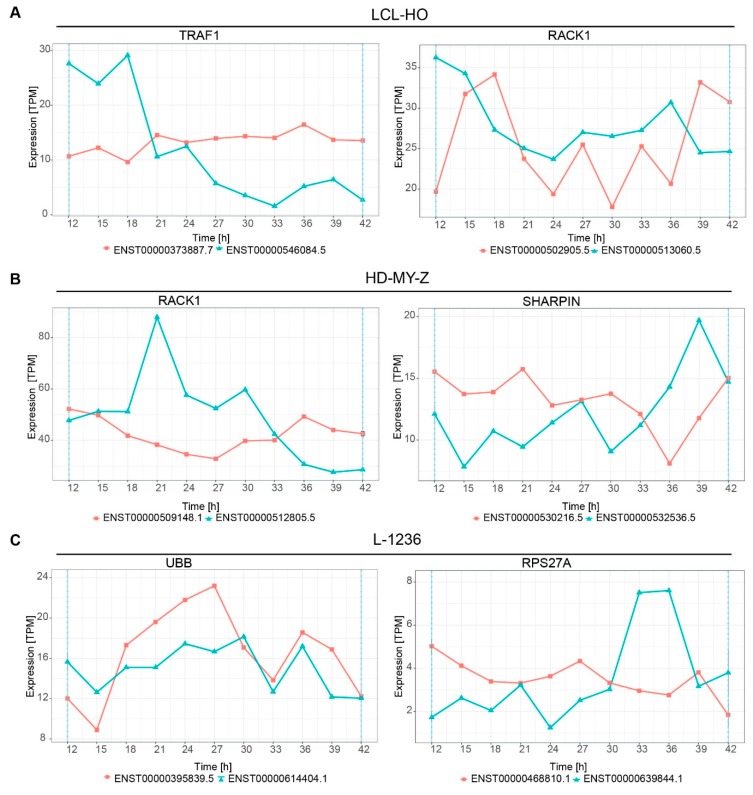
Figure 5.
Multiple genes from the TNF pathway show switching between the isoform expression over time. (A) For the LCL-HO cell line the TRAF1 and RACK1 genes show a differential expression of the corresponding isoforms. (B) For the HD-MY-Z cell line, the RACK1 gene shows switching behaviour between the isoforms. Multiple isoforms of the gene show a switch phenotype over time. The SHARPIN gene shows switching of isoform expression at 36h-39h, corresponding to STP1 for the cell line HD-MY-Z. (C) For the L-1236 only the genes UBB and RPS27A are affected by switching in time between isoform expression within the TNF pathway.

