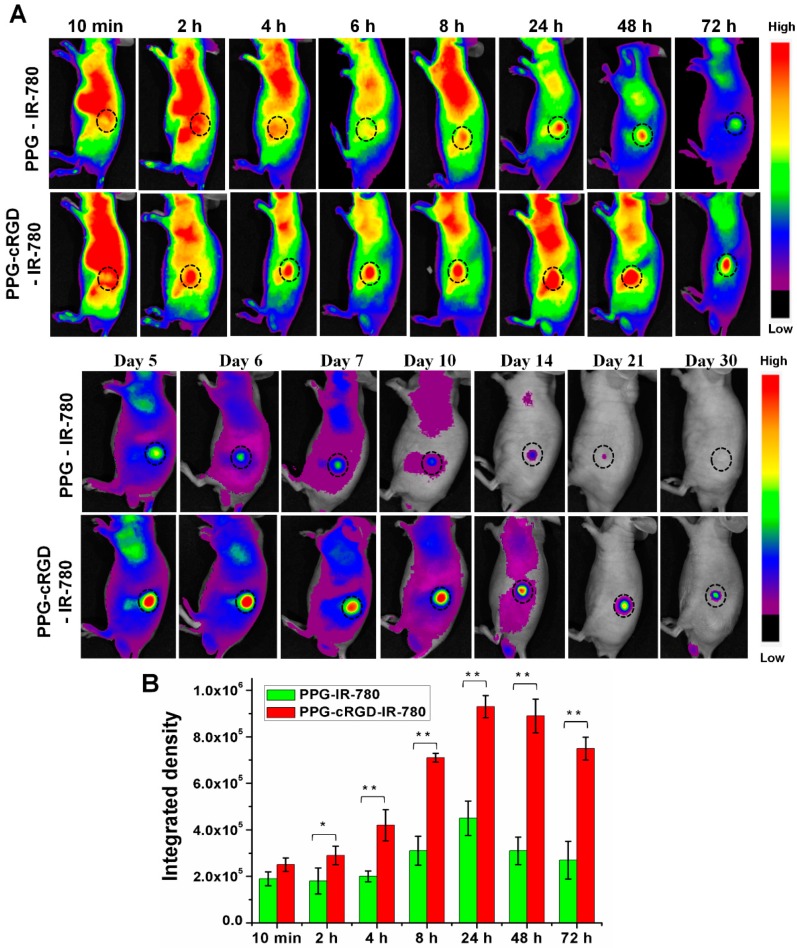
Figure 7.
(A) Biodistribution analysis of PPG-IR-780 NPs and PPG-cRGD-IR-780 NPs in CT26 tumor-bearing nude mice after intravenous administration. Black circle indicates tumor region. (n = 5). (B) Fluorescence intensity quantification of tumor region in a time-dependent manner. The data are shown as mean ± SD (n = 5). * indicates p < 0.05 and ** indicates p < 0.01.

