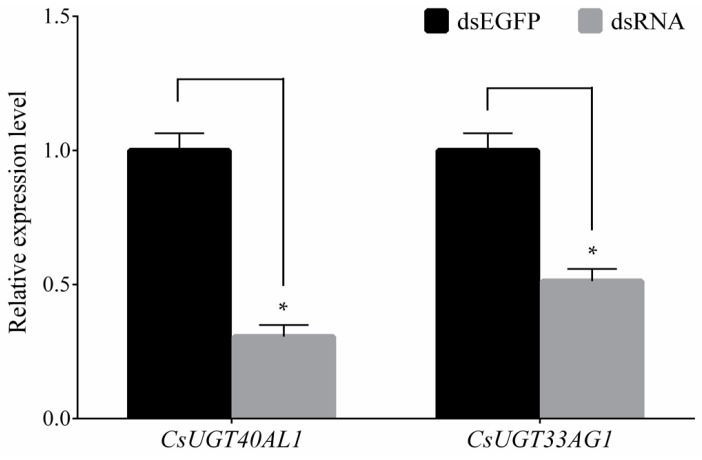
Figure 5.
qRT-PCR analysis of UGT gene expression after individual UGT dsRNA injection in YYR of C. suppressalis. Data were normalized to the expression of G3PDH and Actin A1. Error bars represent the SD from the mean of three independent replicates. There were 30 fourth instar larvae for each biological replicate. Asterisks (*) indicate significant differences between treatments as determined by Student’s t-test (p < 0.05).

