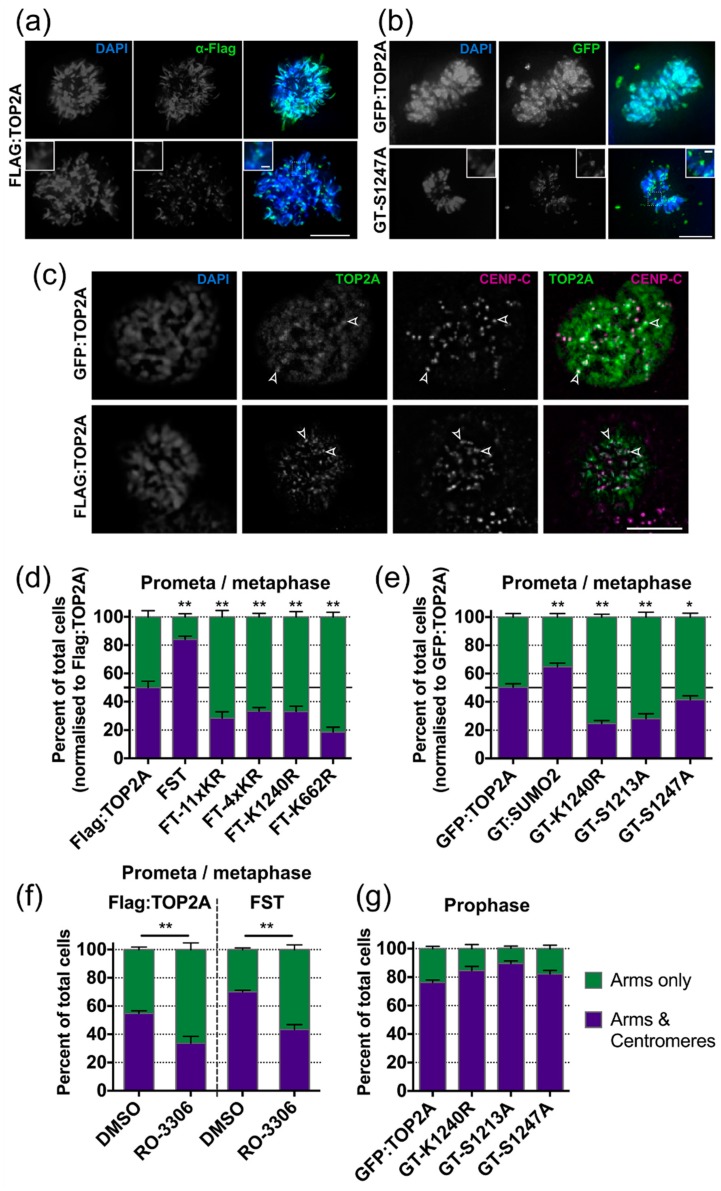
Figure 4.
TOP2A mitotic localisation phenotypes. (a) Representative images of the main TOP2A localisation patterns displayed in mitotic cells expressing Flag-tagged TOP2A (unmutated). Cells were fixed in formaldehyde (PTEMF) and stained using anti-Flag antibody (green). DNA was stained using DAPI (blue). Two main phenotypes were observed: staining along the chromosome arms only or on the arms together with more intense accumulation at centromeres. (b) Representative images of the main TOP2A localisation patterns displayed in mitotic cells expressing GFP-tagged TOP2A (unmutated and S1247A). Cells were fixed in methanol and GFP visualised directly (green). DNA was stained using DAPI (blue). Scale bars in (a,b): main image, 10 μm; inset 1 μm. (c) Immunofluorescence images showing co-localisation of punctateTOP2A signals with centromeres. Cells were fixed in formaldehyde (PTEMF) and stained using anti-TOP2A antibody (green) and anti-CENP-C antibody (magenta). DNA was stained using DAPI. The open arrowheads indicate examples of TOP2A and CENP-C co-localisation. Scale bar: 10 μm. (d) Graph of fixed prometaphase and metaphase cells showing the main TOP2A localisation patterns in stable cell lines expressing various Flag-tagged TOP2A forms. The value for each variant was normalised against the Flag:TOP2A (unmutated) from within the same experiment, with the WT value set as 50%. Three clones were analysed for each TOP2A variant, with three repeats performed for each clone and ~200 cells scored per repeat. Significance was estimated by one-way ANOVA to compare all lines to the Flag:TOP2A (unmutated) with the p value corrected using the post-hoc Tukey HSD analysis for multiple comparisons. Error bars represent s.e.m. (e) Graph of fixed prometaphase and metaphase cells showing the main TOP2A localisation patterns in stable cell lines expressing various forms of GFP-tagged TOP2A. Data collection and statistical analysis were performed as described for (d). (f) Graph showing the percentage of fixed prometaphase and metaphase cells showing the main TOP2A localisation patterns in Flag:TOP2A and FST cell lines one hour after release from overnight (18 h) treatment with the CDK1 inhibitor RO-3306 (or 0.1% DMSO alone). Two independent experiments (each consisting of two parallel replicates) were performed and ≥100 cells scored per sample. Error bars represent s.e.m. Significance was assessed by performing a Student’s t-test. (g) Graph showing the percentage of fixed prophase cells showing intense punctate centromeric TOP2A signals in stable cells lines expressing various GFP-tagged TOP2A forms. Prophase cells were identified on the basis of cyclin B1 staining. One clone was analysed for each TOP2A variant, with three repeats performed for each variant and ~100 cells scored per repeat. Error bars represent s.e.m. ** p = 0.001–0.01, * p = 0.01–0.05.

