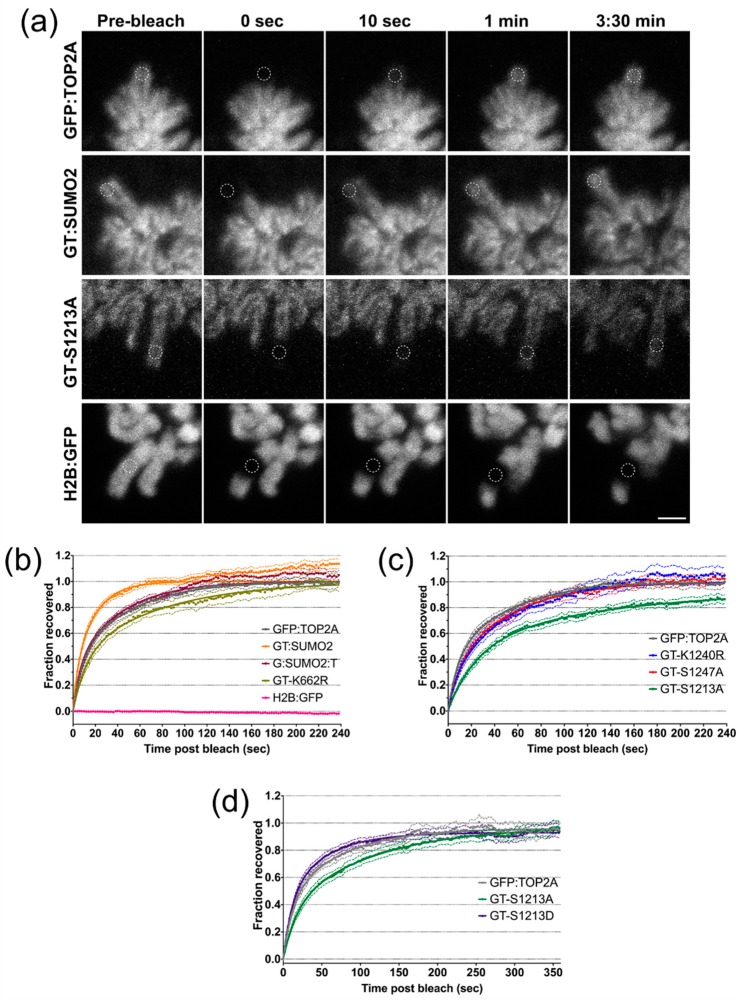
Figure 5.
The mobility of TOP2A on mitotic chromatin. (a) Still images from FRAP movies showing the last frame before bleaching (Pre-bleach), the first frame post-bleach (0 s) and three frames showing progress of recovery at the indicated timepoints. The white dashed line indicates the circular region that has been bleached. Representative images shown for the GFP:TOP2A, GT:SUMO2 and GT-S1213A cell lines respectively. Also included is a cell line expressing H2B:GFP. Scale bar: 2 μm. (b–d) FRAP recovery plots. Normalised mean recovery for the cell lines indicated. Three independent replicates were performed per cell line, with at least 5 movies analysed per replicate. Error bars representing s.e.m. are shown around each recovery curve.

