
Figure 4.
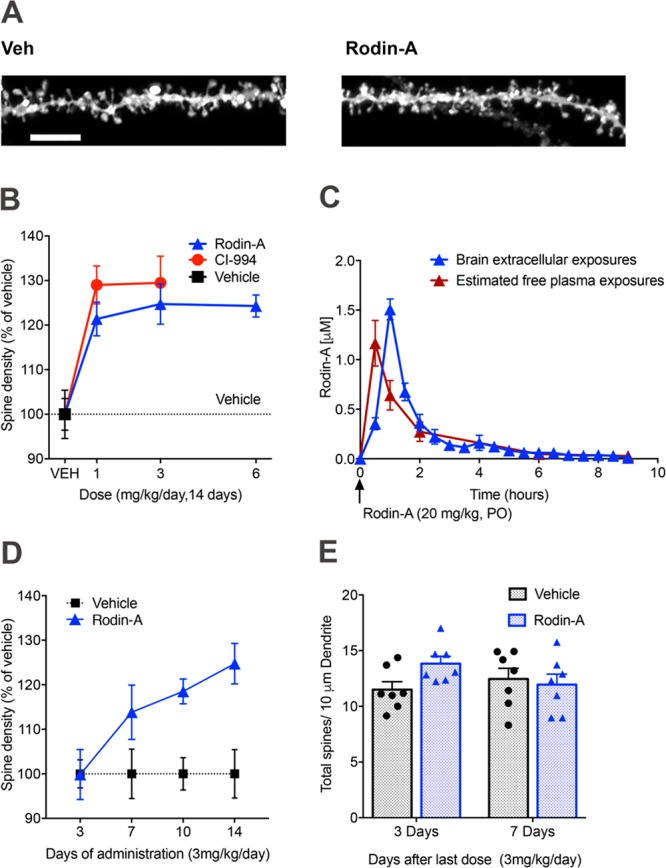
Rodin-A increases synaptic density in mice. (A) Representative three-dimensional images of dendritic spines after ballistic dye labeling (scale bar, 5 μm). (B) Quantification of total dendritic spine density in hippocampal pyramidal neurons in WT mice after 14 days of treatment with Rodin-A (n = 7) or CI-994 (n = 5). Significant increases occur in spine density following treatment of mice with different doses of Rodin-A (mean ± SEM, one-way ANOVA and Dunnett’s post hoc analysis; 1 mg/kg, p = 0.004; 3 mg/kg p = 0.001; and 6 mg/kg, p = 0.0012) and CI-994 (1 mg/kg, p = 0.02; 3 mg/kg, p = 0.018). (C) PK curves from mouse microdialysis experiment with Rodin-A dosed at 20 mg/kg. Exposure curves for brain dialysate showing free exposure in brain at different time points overlaid with estimated free plasma exposures calculated using in vitro plasma protein binding data (fu = 25.1% in mouse plasma in vitro). Free brain-to-plasma ratio (Kpuu) at brain Cmax = 2.4. (D) Total spine density quantification after different duration of daily treatment with Rodin-A (n = 7 animals each). Spine density does not significantly change after 3 or 7 days of treatment but significantly increased after 10 days of dosing (mean ± SEM, unpaired t test, p = 0.0016). (E) Quantification of spine density at different days after last dose (n = 7 animals each) indicates a reversible effect of the drug after 7 days from the last dose. Error bars are SEM.