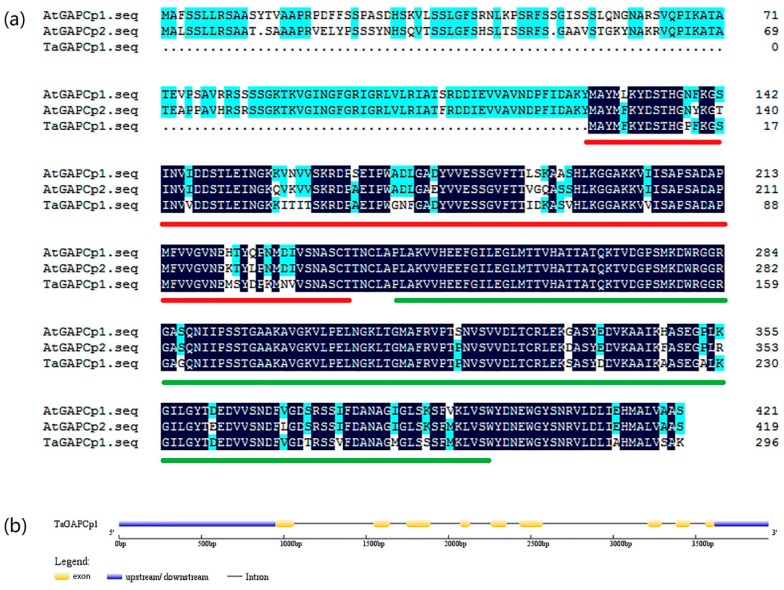
Figure 1.
Sequence analysis. (a) Alignment of the Amino acid sequence of TaGAPCps. The identical and 75% amino acid sequence similarity are separately indicated by mazarine and green color. Red underlined, Glyceraldehyde 3-phosphate dehydrogenase, NAD(P) binding domain (IPR0208); green underlined, Glyceraldehyde 3-phosphate dehydrogenase, catalytic domain (IPR0208). (b) Schematic diagram for exons/introns and upstream/downstream structures of TaGAPCp1. Exons, introns, upstream/downstream are indicated by yellow boxes, black horizontal lines, and blue boxes, respectively.

