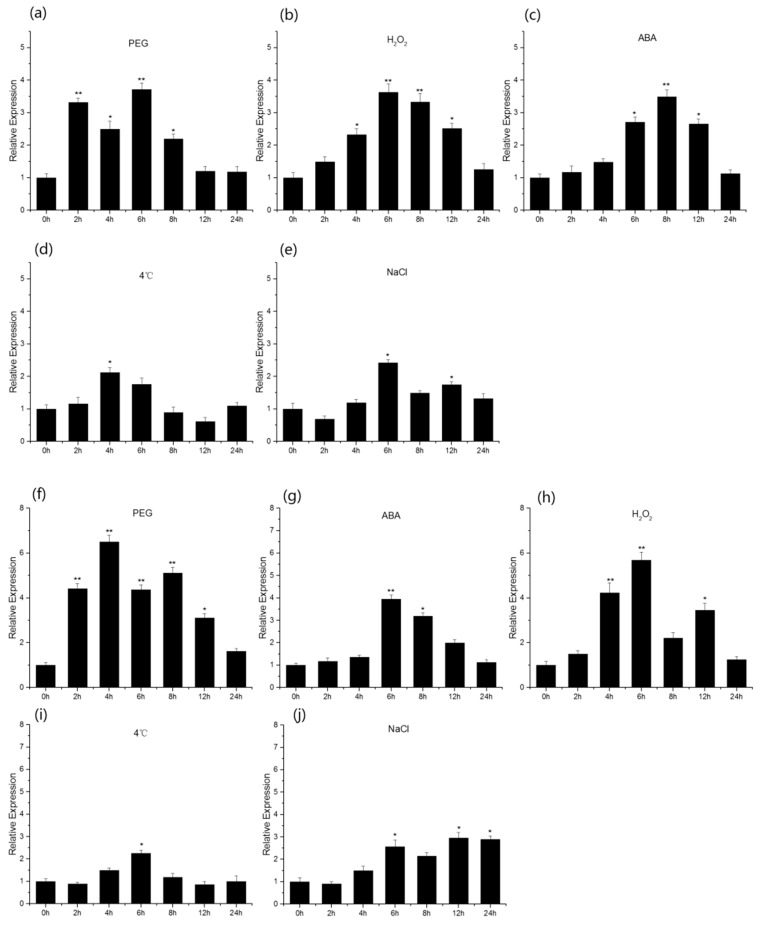
Figure 2.
Expression profiles of TaGAPCp1 in wheat. (a–e) expression patterns of TaGAPCp1 in wheat leaves in response to various abiotic stresses: PEG, ABA (abscisic acid), H2O2, 4 °C, NaCl. (f–j) Expression patterns of TaGAPCp1 in wheat roots in response to various abiotic stresses: PEG, ABA (abscisic acid), H2O2, 4 °C, NaCl. Significant differences were detected by SPSS analysis. * p < 0.05, ** p ≤ 0.01.

