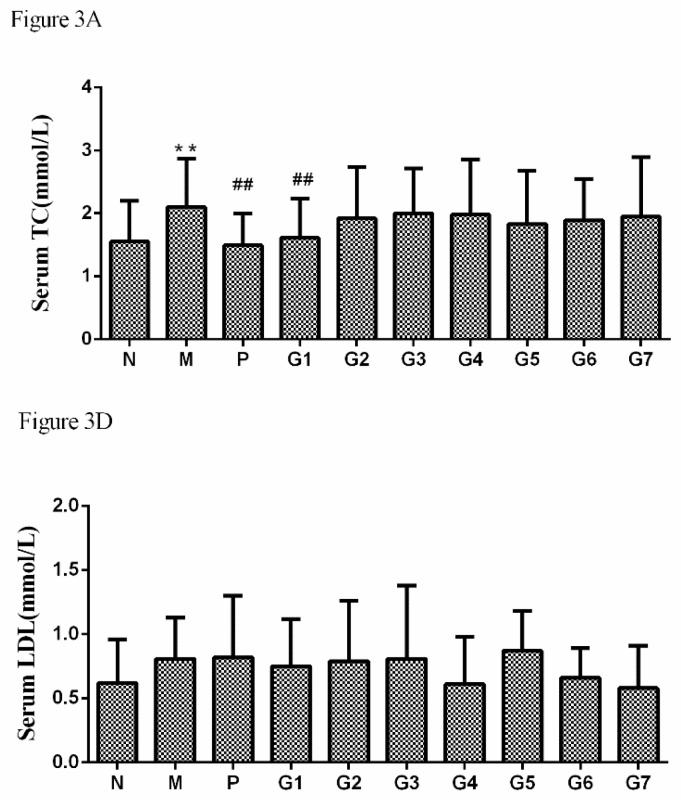
Figure 3.
The effect of glycyrrhizic acid (GA) on lipid profile, including Serum TC (A), and Serum LDL (D). N: normal group, M: model group, P: silybin positive group, G1:18α-GA:18β-GA = 10:0, G2:18α-GA:18β-GA = 8:2, G3:18α-GA:18β-GA = 6:4, G4:18α-GA:18β-GA = 5:5, G5:18α-GA:18β-GA = 4:6, G6:18α-GA:18β-GA = 2:8, G7:18α-GA:18β-GA = 0:10. The values were expressed as mean ± SD (n = 8). ** p < 0.01 vs. normal group, ## p < 0.01 vs. model group.

