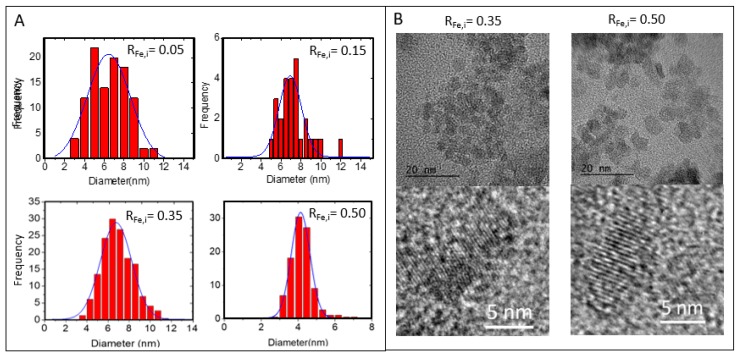
Figure 1.
(A) Size distributions of NPs obtained from Image J processing of the Transmission Electronique Microscopy (TEM) images from 200 NPs, (B) High-Resolution TEM (HR-TEM) images of NP-0.35 (RFe,i = 0.35) and NP-0.50 (RFe,i = 0.50) with corresponding enlargements evidencing the crystalline planes.

