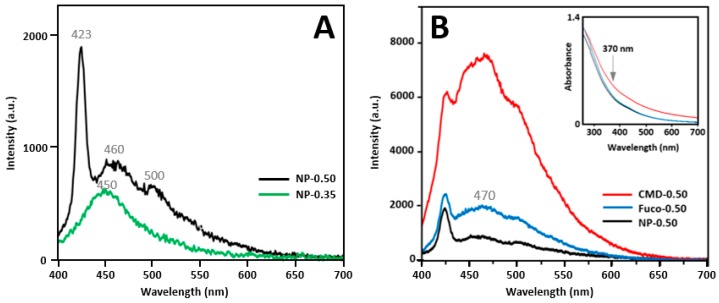
Figure 7.
(A) Fluorescence spectra of NP-0.50 and NP-0.35 with λexc = 370nm, at 2mg/mL in ethanol; (B) Fluorescence spectra of NP-0.50 (in ethanol) and capped NPs (in water) at 2.0 mg/mL, absorption spectra of the samples are provided in the insert. Grey numbers correspond to wavelength maxima (see text).

