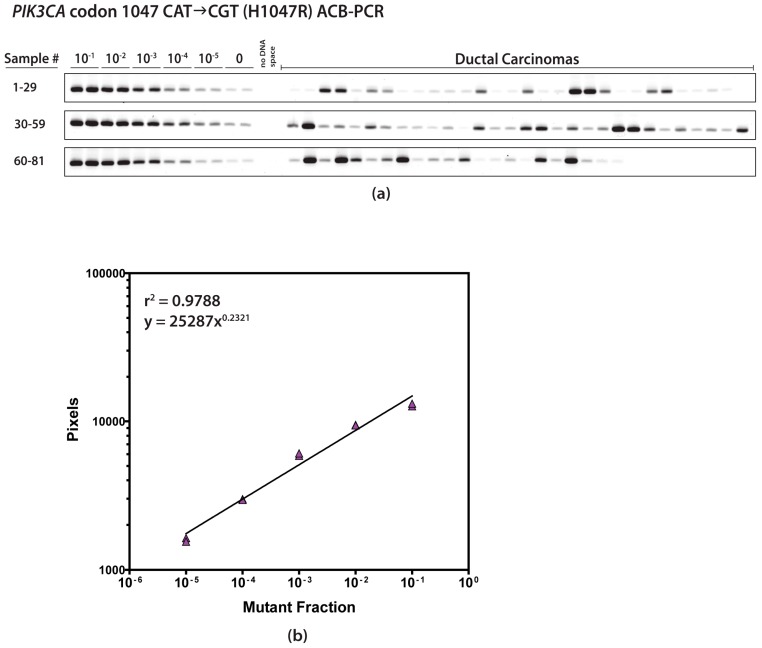
Figure 1.
Representative images of the fluorescein-labeled ACB-PCR products on a polyacrylamide gel are shown for PIK3CA codon 1047 CAT→CGT (H1047R) (a). The pixel intensities of the bands produced from the standards were quantified and used to construct a standard curve relating pixel intensity to MF (b). The standard curve was used to interpolate the MFs of the samples from their measured fluorescence.

