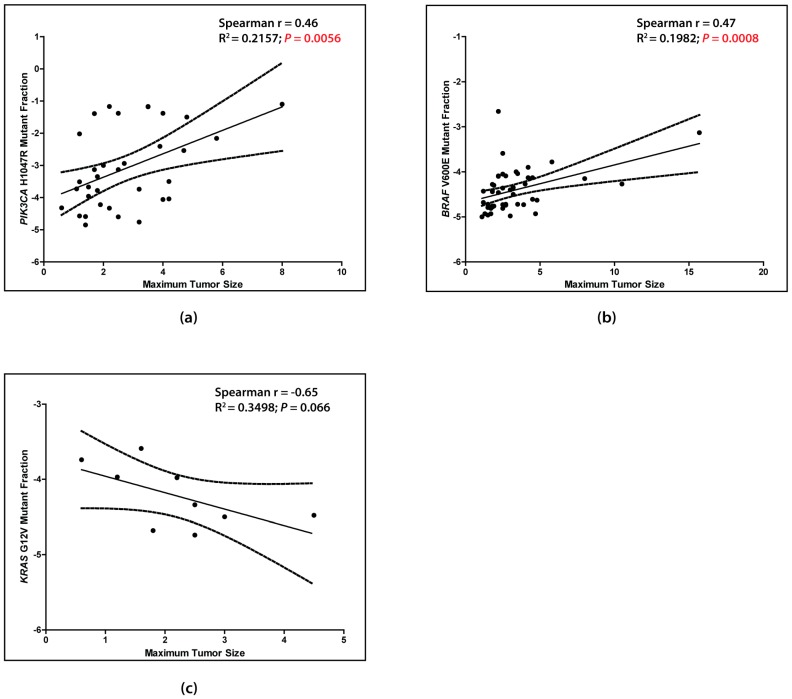
Figure 5.
PIK3CA H1047R (a) and BRAF V600E (b) MFs are correlated positively with maximum tumor dimension. KRAS G12V (c) MF is correlated negatively with maximum tumor dimension (non-significant). Correlation analyses were conducted using samples with MFs ≥ 1 × 10⁻⁵. The solid line denotes the linear regression line. Dashed lines denote the 95% confidence interval. p values ≤ 0.05 are in red.

