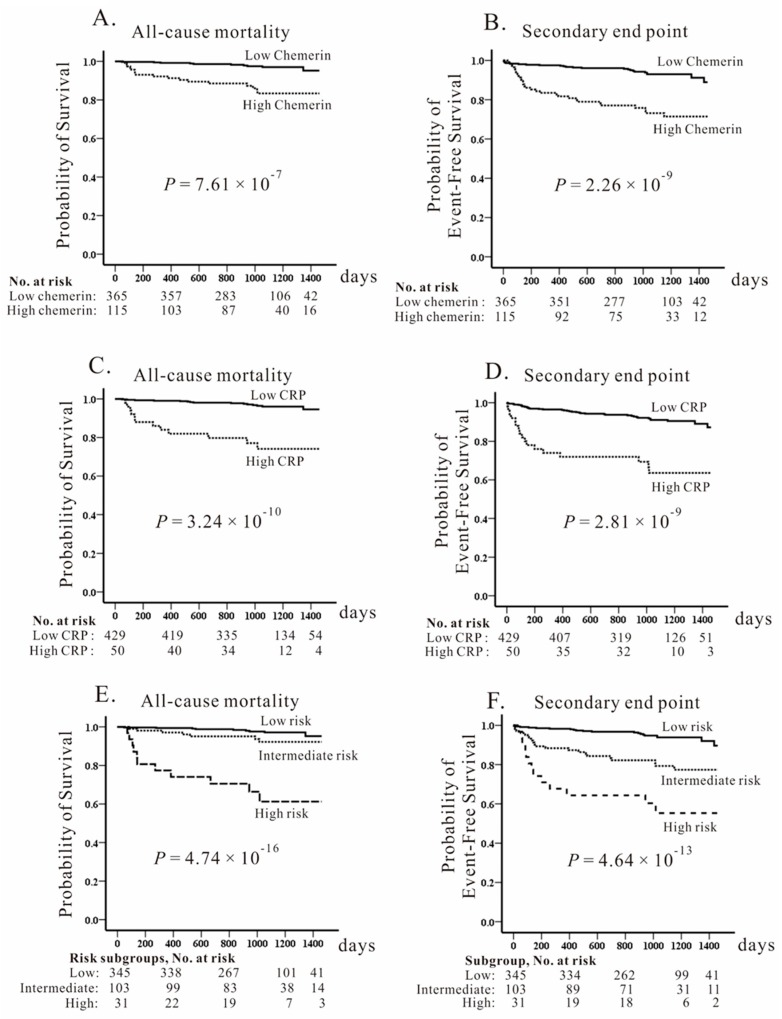
Figure 2.
Kaplan–Meier curves of the cumulative incidence of primary and secondary endpoints. Individuals are stratified according to chemerin levels (>163.8 ng/mL vs. ≤163.8 ng/mL) (A,B) and C-reactive protein (CRP) levels (>9.7 mg/L vs. ≤9.7 mg/L) (C,D) as well as their combination (E,F) in patients with angiographically confirmed coronary artery disease (CAD). Significantly higher mortality and combined endpoints for CAD were noted for higher chemerin and CRP levels as well as higher risk subgroups of combined chemerin/CRP levels. The study patients were followed for 1022 ± 320 days.

