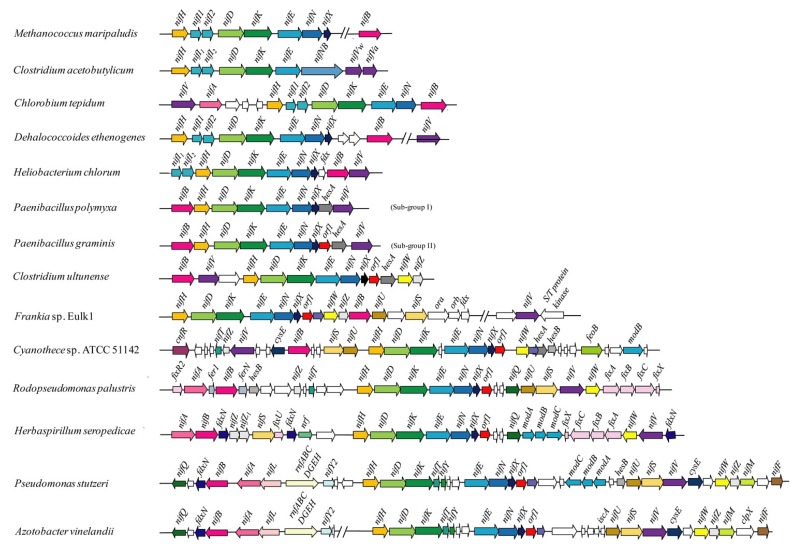
Figure 1.
Comparison of the nif gene clusters from the representatives of anaerobic, facultative anaerobic, and aerobic N2-fixing microorganisms. Sequence of the identified regions was retrieved from GenBank and used to draw the diagram. Genes of the same color in different organisms are homologous. The orf1 and its homologous genes are colored in red.

