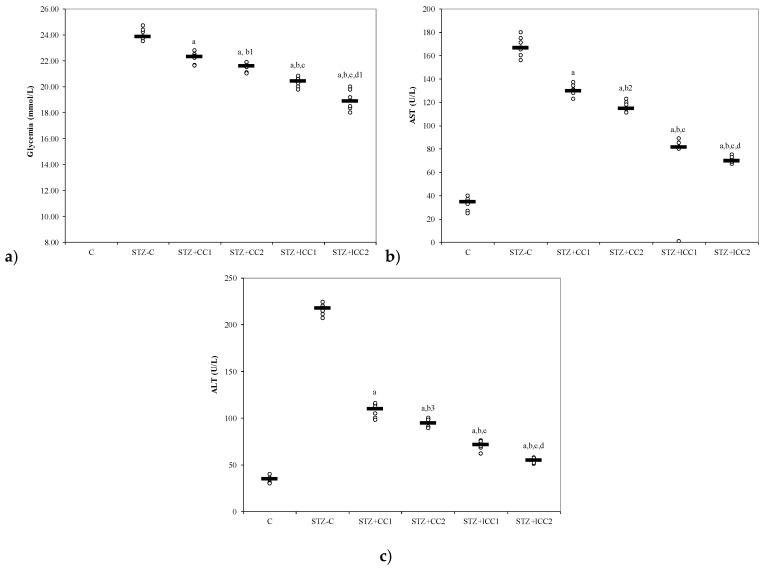
Figure 3.
Variability of (a) glycemia, (b) AST (aspartate aminotransferase) and (c) alanine aminotransferase (ALT) by groups. C = control; STZ-C = streptozotocin control; STZ + CC1 = STZ and 1 mg/100 g bw CC as pre-treatment; STZ + CC2 = STZ and 2 mg/100 g bw CC as pre-treatment; STZ + lCC1 = STZ and pre-treatment with 1 mg/100 g bw lCC; STZ + nCC2 = STZ and pre-treatment with 2 mg/100 g bw lCC. a p-values < 0.002 as compared to STZ-C group; b p-values < 0.002 as compared to STZ + CC1 group excepting b1 0.0152, b2 0.0027, and b3 0.0060; c p-values < 0.002 as compared to STZ + CC2 group excepting c1 0.0040; d p-values < 0.002 as compared to STZ + lCC1 group excepting d1 0.0040.

