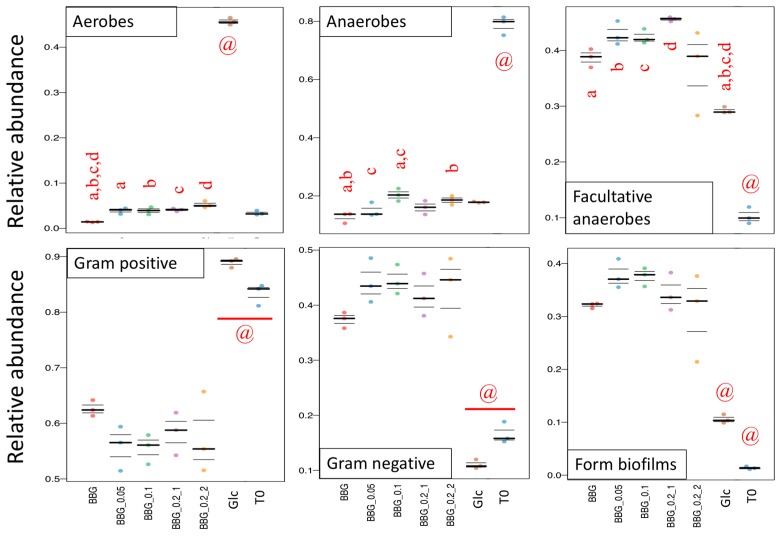
Figure 4.
Predicted output of selected phenotype by BugBase. Relative abundance of aerobes, anaerobes and facultative anaerobes are in the upper panel. Gram-positive bacteria, Gram-negative bacteria and taxa that are predicted to form biofilm are given in the lower panel. Significant difference analyzed by one-way ANOVA (Tukey HSD post-hoc test), p < 0.05. @: denotes statistically significant different from all other groups.

