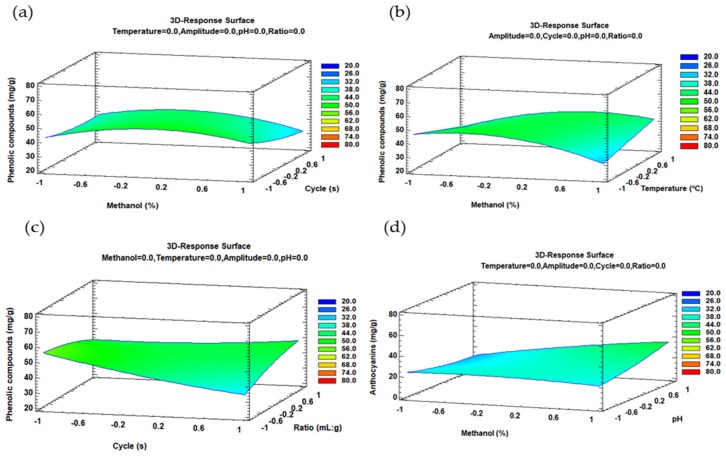
Figure 2.
3D-surface plots of the Box–Behnken design to represent the influence of: (a) Solvent composition and cycle on the total phenolic compounds; (b) solvent composition-temperature on the total phenolic compounds; (c) cycle-ratio on the total phenolic compounds; (d) solvent composition-pH on the total anthocyanins.

