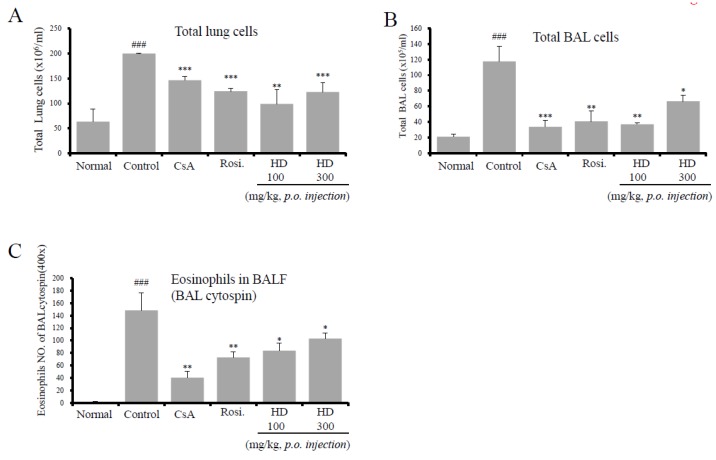
Figure 2.
The effects of HD on total BALF cells, total lung cells, and eosinophils in BALF. Total lung cells (A), total BAL cells (B), and eosinophils in BALF (C). Results are expressed as mean ± SEM (n = 6). * p < 0.05, ** p < 0.01, and *** p < 0.001, for the OVA control group versus the experimental group comparisons. ### p < 0.001, for the normal group versus the OVA control group comparison. N: Normal BALB/c mice; CT: OVA inhalation plus vehicle; CsA: OVA inhalation plus cyclosporine A, 10 mg/kg’ Rosi: OVA inhalation plus rosiglitazone, 2 mg/kg; HD: OVA inhalation plus HD (100 or 300 mg/kg).

