Figure 3.
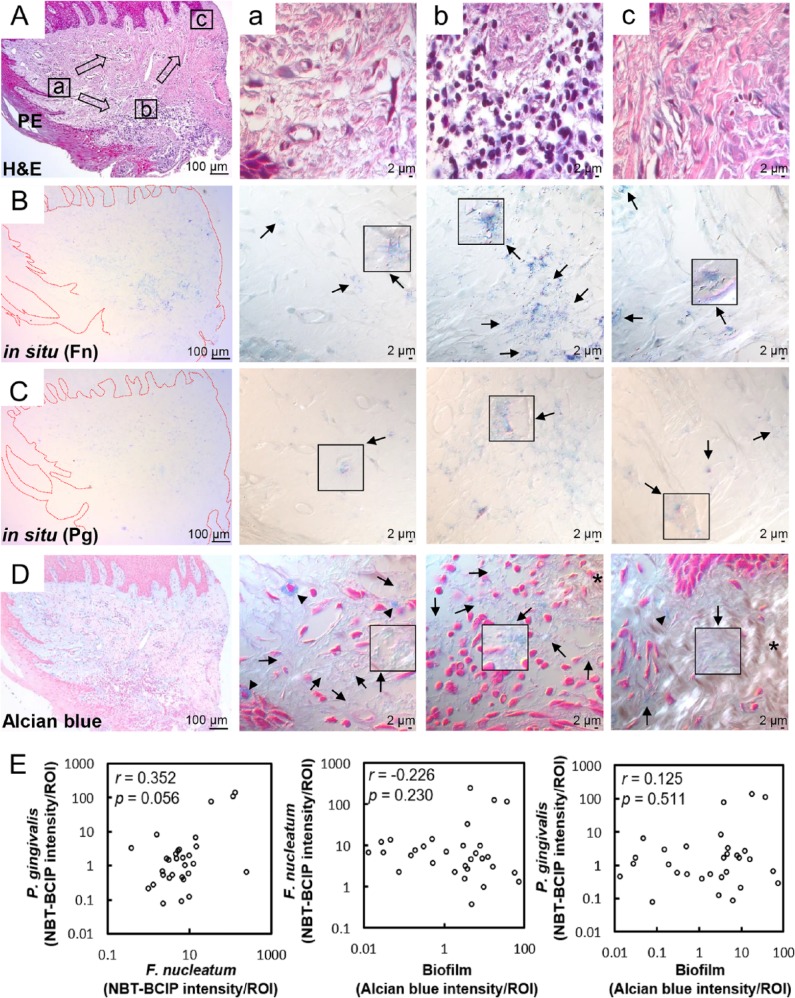
Distribution of Fusobacterium nucleatum, Porphyromonas gingivalis, and biofilm within the gingival tissue. (A) Tissue sections were stained with hematoxylin and eosin (H&E). Three areas (a, b, c) were examined under high magnification (×1,000) with differential interference contrast microscopy. Arrows indicate the potential directions of infection spread. PE, pocket epithelium. (B, C) Tissue sections were in situ hybridized with F. nucleatum– and P. gingivalis–specific probes, respectively. Arrows, bacterial signals; insets, areas with biofilm-like structure are magnified. (D) Tissue sections were stained with 1% alcian blue for acid mucopolysaccharide and counterstained with nuclear fast red. Arrows, biofilm-like structures; arrowheads, mast cells; asterisk, area with intact connective tissue fibers. (E) Correlation plots between bacterial signals and biofilm formation (r and P values by Spearman’s rank correlation test). ROI, region of interest. See Appendix Figure 3 for DIC images taken by confocal microscopy.

