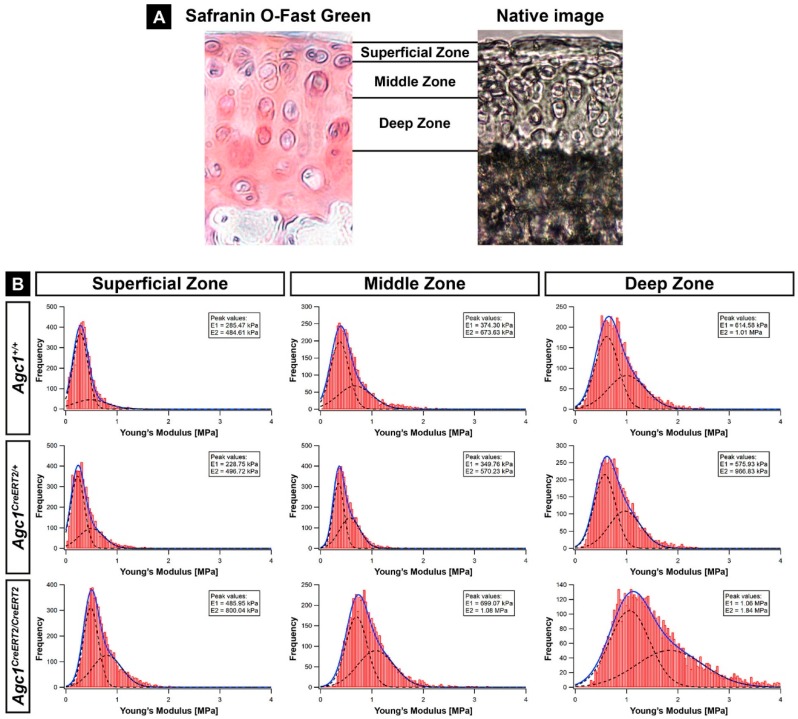
Figure 3.
IT-AFM reveals stiffening of articular cartilage in Agc1CreERT2/CreERT2 mice at six months of age. (A) Safranin Orange /Fast Green staining and an overview image of a native articular cartilage section show the zones assessed by IT-AFM (40× magnification); (B) histograms showing the stiffness distribution in various zones of the tibial plateau cartilage determined by nano-indentation (n = 3 animals in each group). On each histogram, the solid line represents the sum of two Gaussian functions, whereas the dashed lines indicate individual fits. The first and the second stiffness peaks (E1 and E2) represent the proteoglycan gel and the collagen fibrils, respectively. n = 3 animals per genotype.

