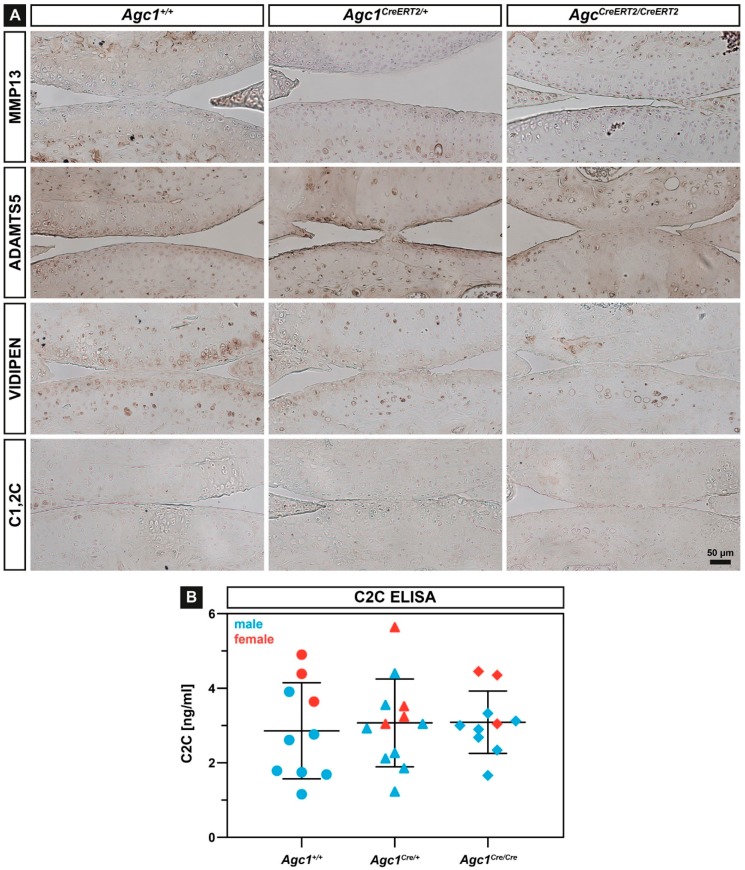
Figure 5.
Analysis of cartilage catabolism. (A) representative immunostaining of MMP-13, ADAMTS-5, VIDIPEN and C1,2C of sections from the articular cartilage at 12 months of age in Agc1+/+, Agc1CreERT2/+ and Agc1CreERT2/CreERT2, mice. n = 5 per genotype; (B) C2C ELISA assay in urine of 12-month-old animals. Bars represent mean ± SD. n = Agc1+/+: 6(m)/4(f); Agc1Cre/+: 8(m)/4(f); Agc1Cre/Cre: 7(m)/3(f).

