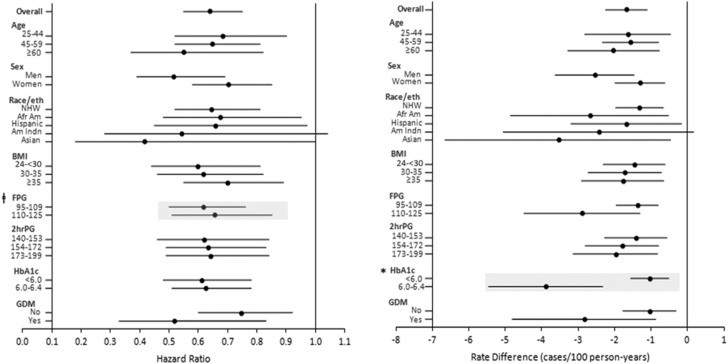
Figure 2.
Forest plot of diabetes HRs and hazard RDs with diabetes defined by HbA1c levels for metformin vs. placebo over 15 years by subgroups defined at DPP baseline. Point estimates and 95% CIs shown. Highlighted rows show significant treatment-by-group interactions. Group interactions were tested using continuous values for baseline values of age (years), BMI (kg/m2), FPG and 2-h glucose (2hrPG) (mg/dL), and HbA1c (%). Statistically significant (P < 0.05) interactions of metformin treatment by subgroup are indicated by shading and as follows: *HbA1c-by-treatment interaction P = 0.001; ‡FPG-by-treatment interaction P = 0.04. Afr Am, African American; Am Indn, American Indian; eth, ethnicity; GDM, history of prior GDM; NHW, non-Hispanic white.

