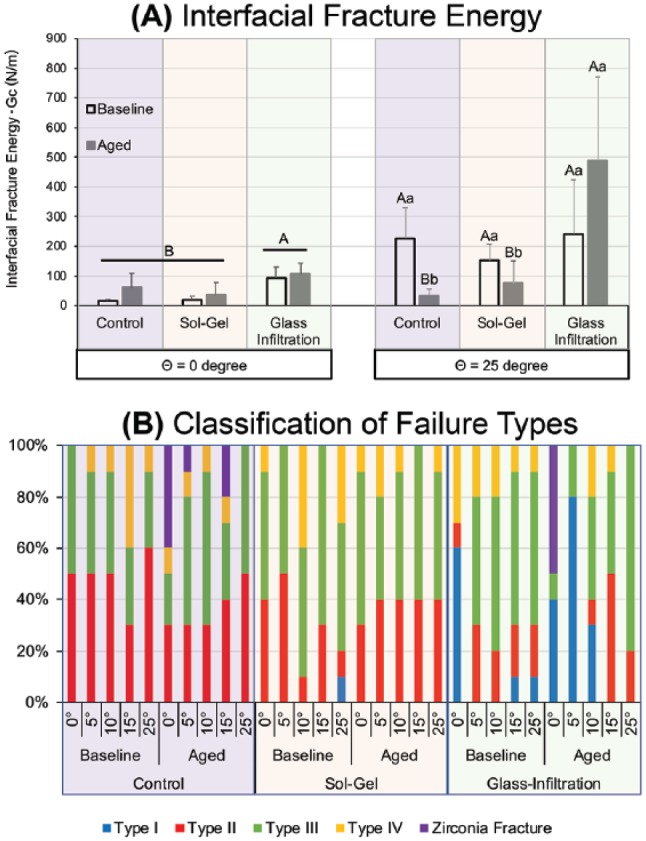
Figure 3.

Interfacial fracture test results: (A) Average interfacial fracture energy under pure tension (Θ = 0°) and predominantly shear (Θ = 25°) for each surface treatment and time. Uppercase letters indicate statistical differences among surface treatments, within stress type (Θ). Lowercase letters indicate statistical differences between baseline and aging within surface treatment and stress type. (B) Classification of failure type distribution in each test condition.
