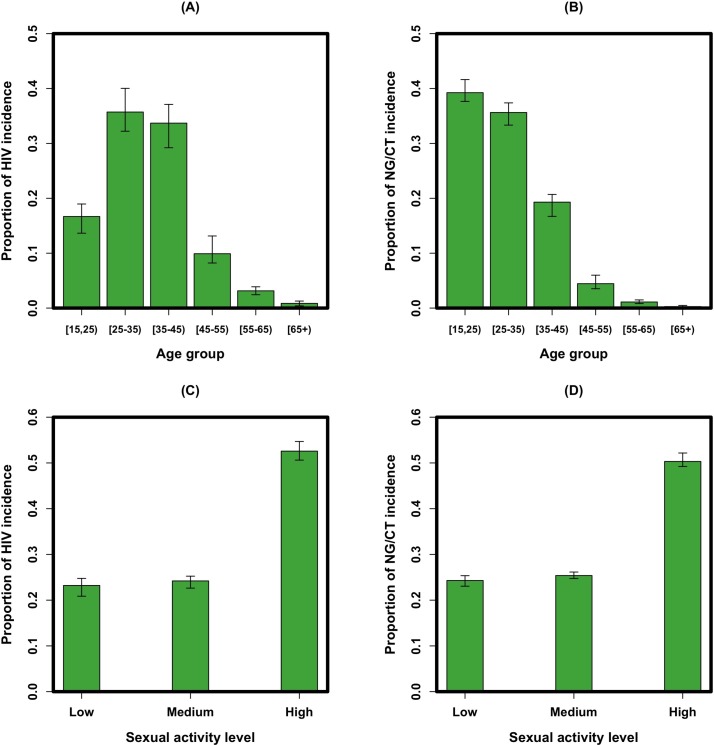
Figure 2.
Model projections of the distribution of new infections by age and sexual activity level. Shown on the y-axes are the distribution of HIV (A) and NG/CT (B) incidence by age group and the distribution of HIV (C) and NG/CT (D) incidence by the sexual activity level. Bars represent the mean values of simulations (in green) with error bars representing the 95% uncertainty range of observations around each simulated measure. NG/CT, Neisseria gonorrhoeae/Chlamydia trachomatis.

