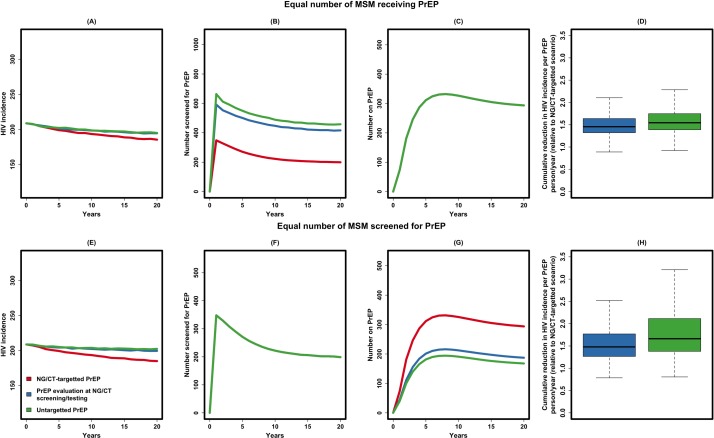
Figure 4.
Relative impact of NG/CT-integrated PrEP. Shown in this figure is the relative impact of NG/CT-integrated PrEP (in red, also corresponding to the red line in figure 3), compared against PrEP evaluation at NG/CT screening/testing (in blue) and untargeted PrEP (in green), with full description of these scenarios given in the manuscript text. In the first set of experiments, the three strategies are compared under the assumption that the same number of MSM would receive PrEP (panel A to D), or the same number of MSM would be screened for PrEP (panel E to H). Panel A gives the annual incidence of HIV, panel B the number of MSM approached for PrEP, panel C the number of MSM on PrEP at any point in time (all three lines overlapping) and panel D the cumulative reduction in HIV incidence per PrEP person-year in untargeted scenarios relative to NG/CT-targeted scenario (similar pattern in panel E through H). MSM, men who have sex with men; NG/CT, Neisseria gonorrhoeae/Chlamydia trachomatis; PrEP, pre-exposure prophylaxis.

