Fig. 3.
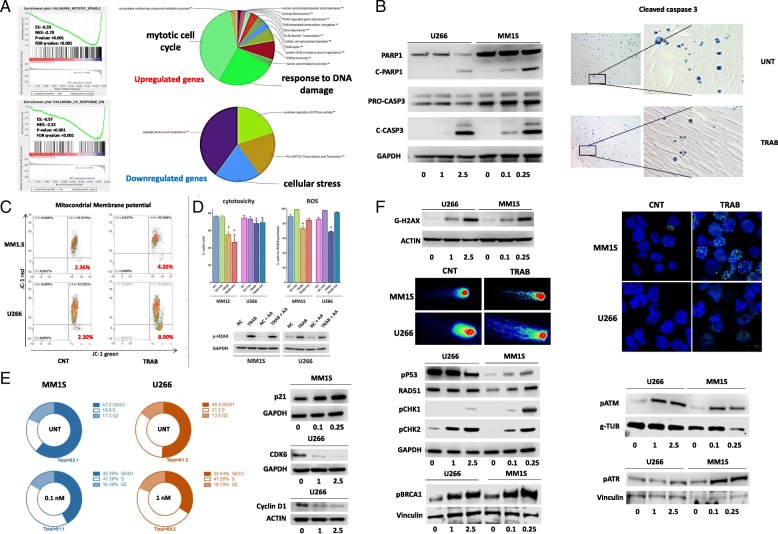
Trabectedin affects many cellular pathways. a On the upper left panel, the enrichment plots show significant gene-sets identified using GSEA software on U266 RNA. The green curve represents the enrichment score curve. On the right, the pie charts report different gene sets with up- or downregulation involved in trabectedin activity. b Western blot data showing levels of pro-apoptotic proteins c-PARP and c-caspase 3 after trabectedin treatment in U266 and MM1S cells. On the right, immunohistochemistry images showed brown foci of activated c-caspase 3 in trabectedin-treated U266 3D model compared to control. c Dot plots demonstrated modifications in mitochondrial membrane potential in MM1S and U266 cells trabectedin-treated respect to control. d Histograms representative of three independent experiments showed apoptosis induction and ROS production, after trabectedin treatment in U266 and MM1S cells, in the presence or absence of ascorbic acid (25uM) as antioxidant. In the lowest part, Western blots reporting the expression of gamma-H2AX in U266 and MM1S alone or in the presence of trabectedin and/or ascorbic acid. e On the left, a representation of the four phases of cell cycle, in two MM cell line (blue chart for MM1S and orange for U266), untreated or exposed to trabectedin. On the right, Western blot reported the expression of protein involved in cell cycle: p21 in MM1S and cyclin D1 and CDK4 in U266. f A representation of Western blot of g-H2ax expression in U266 and MM1S cells, in the upper panel. In addition, in single-cell gel electrophoresis (Comet) assay DNA strand breaks are identified through structures resembling comets, observed by fluorescence microscopy. The representative images showed the DNA damage in U266 and MM1S cell lines treated with 2.5 and 0.1 nM of trabectedin, respectively. Western blot images showed different proteins involved in DNA damage and belonging to DNA repair system. On the right top, immunofluorescence image showing green g-H2ax foci within MM1S and U266 nuclei exposed to 0.1 nM and 2.5 nM of trabectedin, respectively. *p < 0.05

