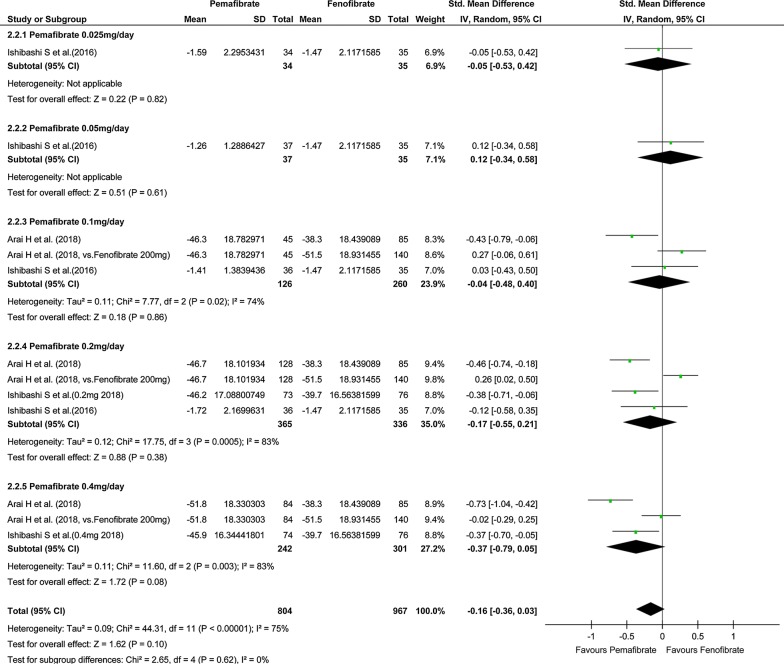
Fig. 3.
Forest plot presenting meta-analysis based on SMDs for effect of pemafibrate versus fenofibrate on TGs. SMDs in the individual studies are presented as squares with 95% confidence intervals (CIs) presented as extending lines. The pooled SMD with its 95% CI is depicted as a diamond. SMDs, standardized mean differences; TG, triglycerides

