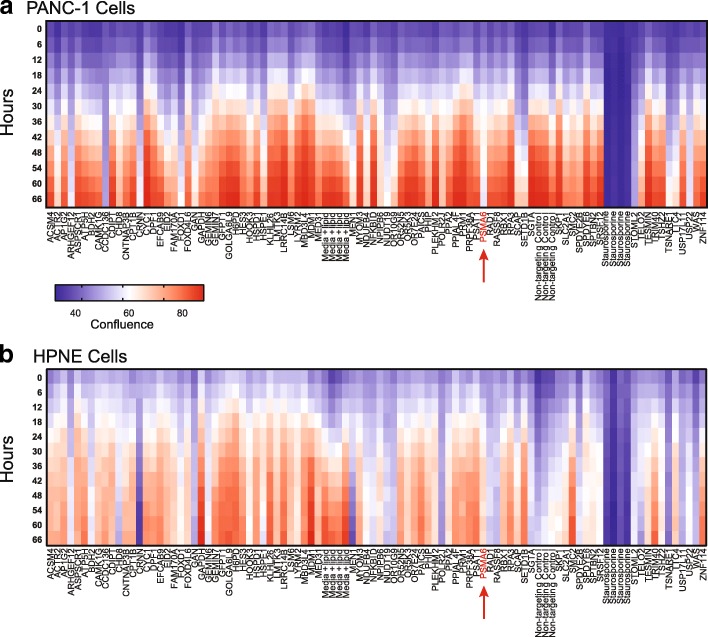
Fig. 2.
Heat map and hit validation using a pool of siRNAs in PANC-1 and HPNE cells. Heat map showing cell confluence (measured with the IncuCyte Live Cell Analysis System) after transfection of siRNA into a PANC-1 cells and b HPNE cells. PSMA6 is shown in red text and indicated by an arrow. The cell confluence is color coded: blue represents low confluence and red represents high confluence, as measured by live-cell imaging over 66 h. Samples were normalized to controls treated with 1 μM staurosporine (as a positive control for cell death) and lipid reagent alone

