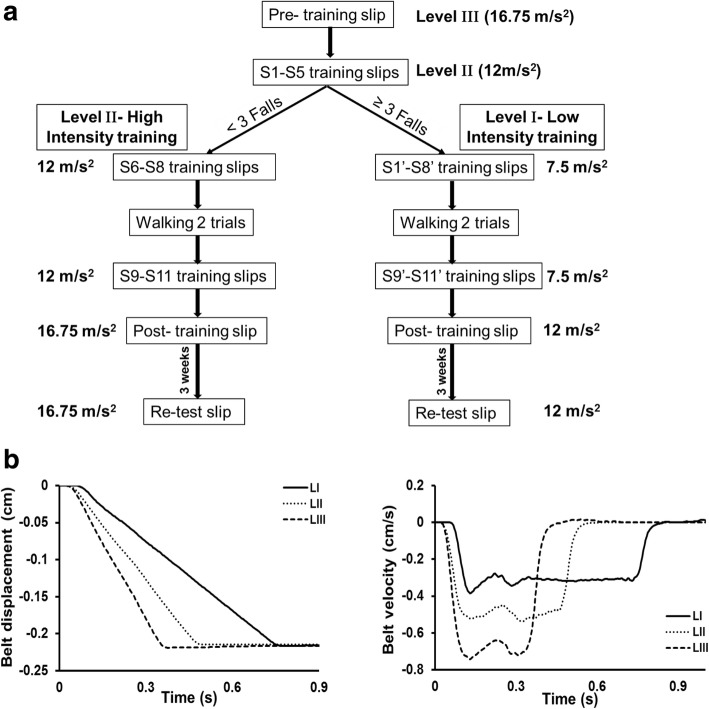
Fig. 1.
a Shows the research design and experimental protocol along with the intensities of perturbation for pre-training, training, post-training, and retest trials. The mark ‘indicating perturbation trials at lower intensity. b Shows the trajectory of belt displacement and the velocity profiles for the different perturbation intensities (level I, II and III) used for assessment and training

