Fig. 1.
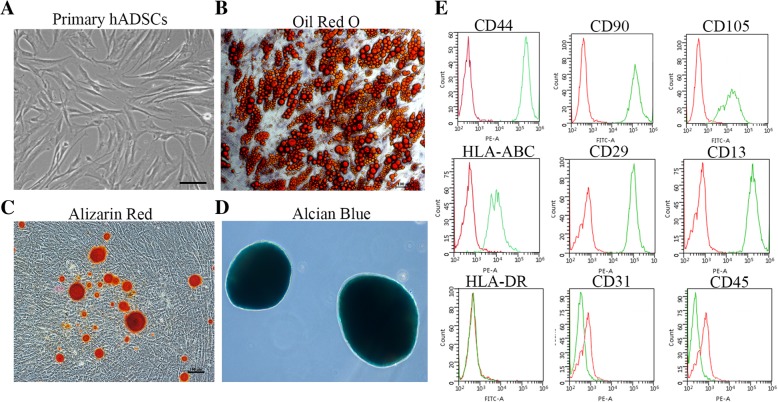
Characterization of hADSCs. a Representative photos of the morphology of hADSCs. Bar = 100 μm. b–d The adipogenic, osteogenic and chondrogenic ability of hADSCs were identified by Oil red O staining (b), Alizarin Red staining (c), and Alcian Blue binding (d), respectively. Bar = 100 μm. e Flow cytometric analysis identified the positive surface markers CD44, CD90, CD105, HLA-ABC, CD29, and CD13 and the negative surface markers HLA-DR, CD31, and CD45. The green line represents the signal of the antibody we detected, and the red line represents the signal of the isotype control

