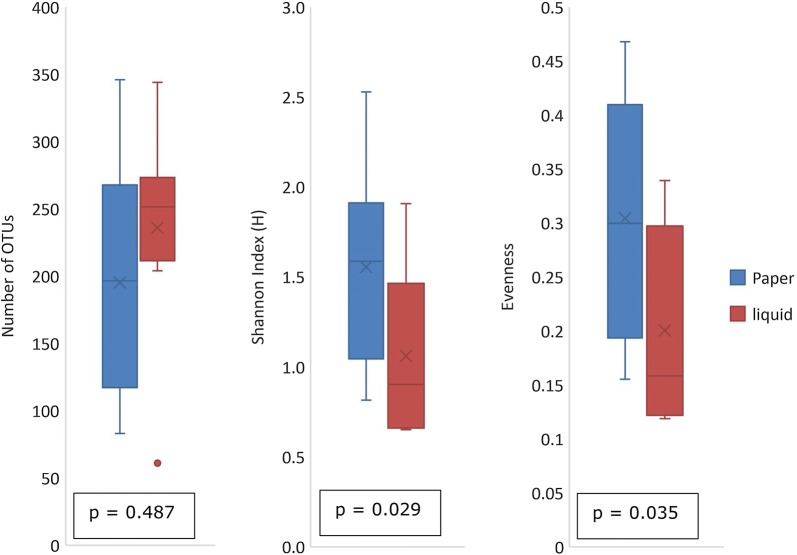
Fig. 2.
Number of OTUs, Shannon index and community evenness of filter paper samples and liquid samples. Comparison of eight samples which were all stored using the filter paper method as well as cooled to 4 °C before shipment from Zambia to the laboratory in the Netherlands were the DNA was extracted using the corresponding methods. P values are from the related-samples Wilcoxon signed rank test and show no difference between number of OTUs, but difference in OTU distribution (in both Shannon index and evenness)

