Figure 1.

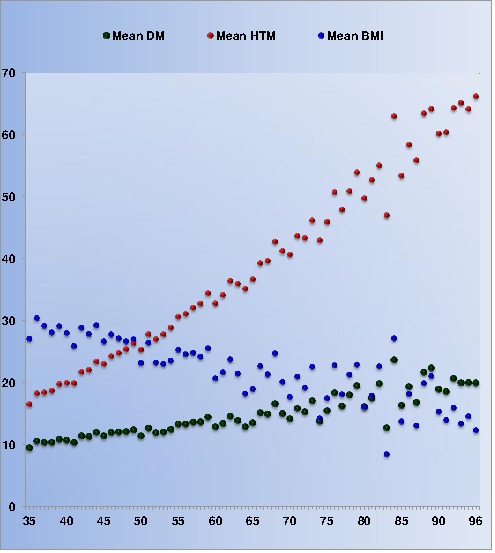
Scatter plot between age with blood glucose, systolic blood pressure, diastolic blood pressure and BMI. BMI, body mass index; DM, diabetes mellitus; HTN, hypertension.

Scatter plot between age with blood glucose, systolic blood pressure, diastolic blood pressure and BMI. BMI, body mass index; DM, diabetes mellitus; HTN, hypertension.