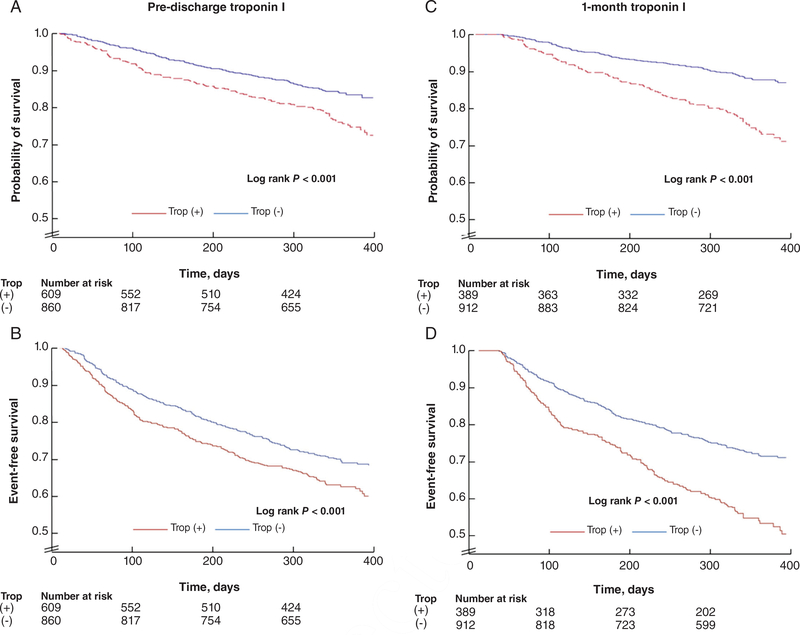
Figure 3.
Kaplan–Meier curves for (A) all-cause mortality and (B) cardiovascular mortality or hospitalization for heart failure at 12 months follow-up by pre-discharge troponin I status, and (C) all-cause mortality and (D) cardiovascular mortality or hospitalization for heart failure at 12 months follow-up by 1-month post-discharge troponin I status. Times to events were compared using log-rank tests

