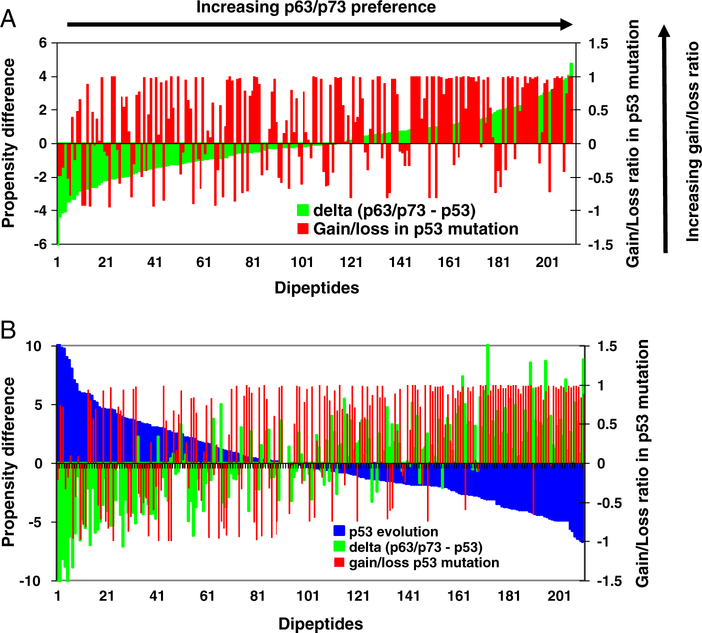
Fig. 3.
The correlations of p53 dipeptide gain/loss ratios with evolution and with the gap of dipeptide propensities in p63/p73 and in p53. (A). p53 dipeptide gain/loss ratios increase with increasing gap of peptide propensities in p63/p73 and in p53. The green lines represent the differences between dipeptide propensities in p63/p73 and in p53, and the red lines are gain/loss ratios for the corresponding dipeptides. The dipeptides are ordered with the value of Δ(p63/p73−p53). (B). p53 dipeptide gain/loss ratios increase with the decreasing dipeptide propensities in evolution. The green lines represent the differences between dipeptide propensities in human p63/p73 and p53, and the red lines are gain/loss ratios for the corresponding dipeptides. The blue lines are the changing of dipeptide propensities in evolution. The dipeptides are ordered with the decreasing value of dipeptide propensities in evolution.

