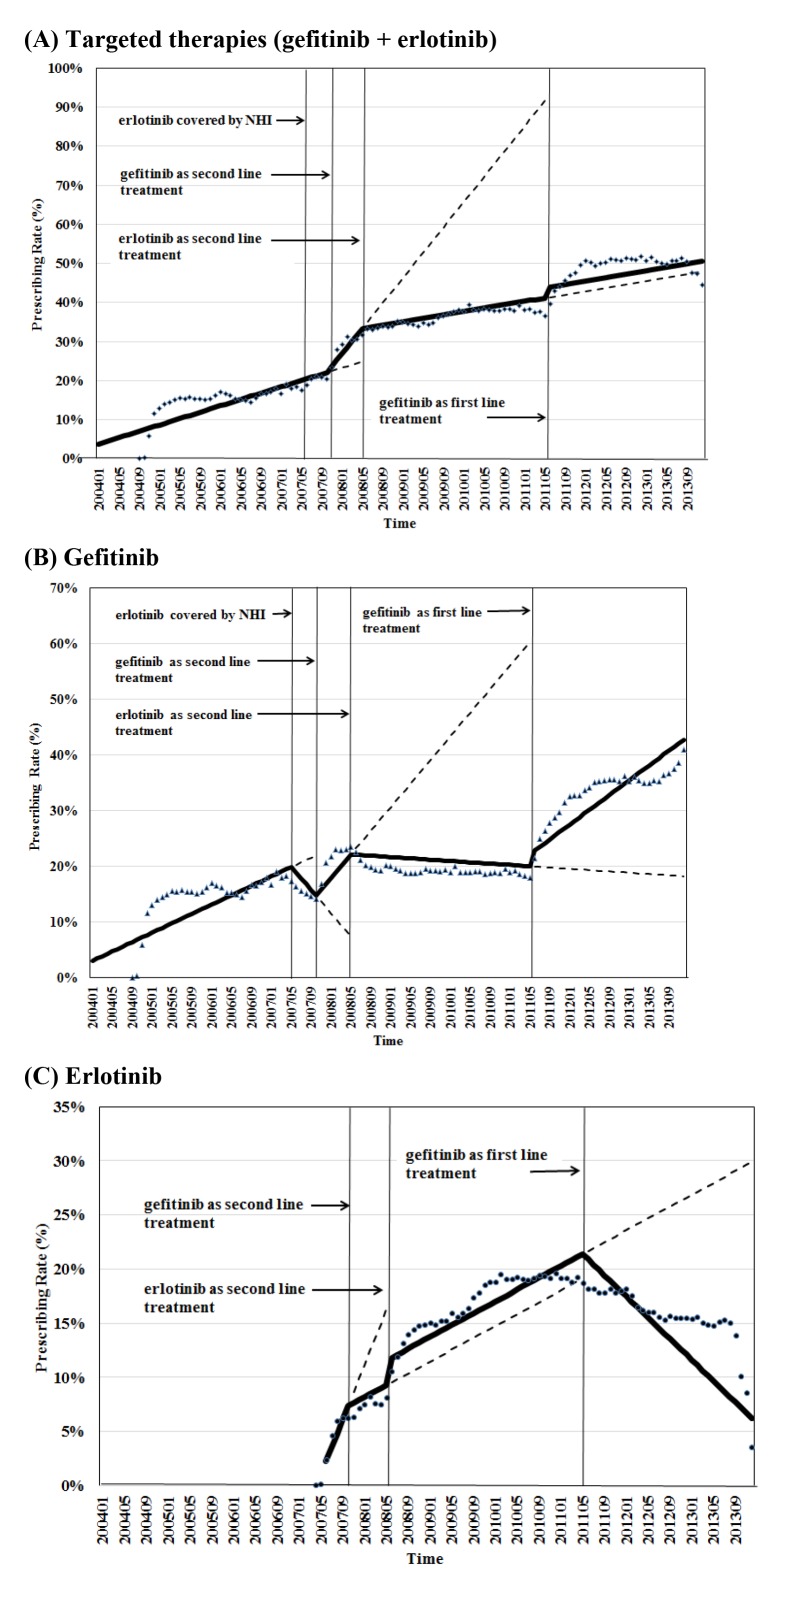
Figure 1.
Prescribing rate by patient number of targeted therapies over time: (A) Targeted therapies (gefitinib +erlotinib). (B) Gefitinib. (C) Erlotinib. Prescription rate of targeted therapies by patient number=number of patients who used targeted therapies/number of patients who used antineoplastic agents. NHI, National Health Insurance.

