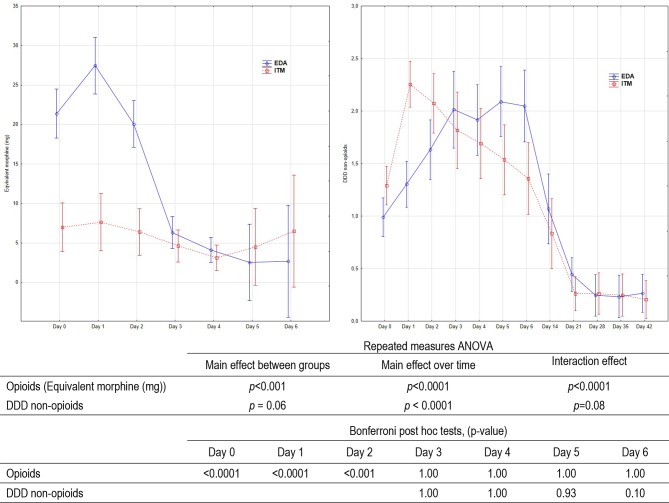
Figure 4.
Consumption of analgesics after surgery in relation to occasion of measurement. Plots represent means and bars represent 95% CI. Results of the repeated measures analysis of variance (ANOVA) and post hoc tests from day 0 to the day 6 assessment for equivalent morphine given and for day 3 to day 42 for defined daily dose (DDD) non-opioids are presented in the table below the diagram. EDA, epidural analgesia; ITM, intrathecal morphine analgesia.

