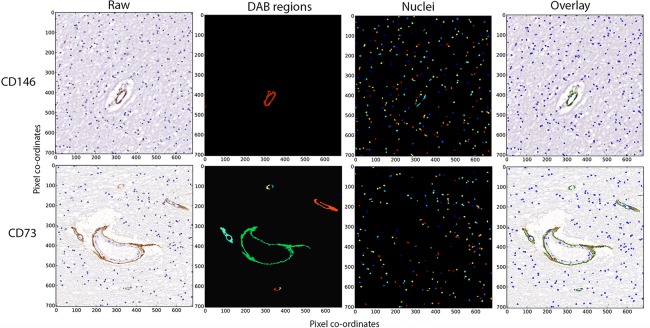
Figure 1.

Image analysis workflow. Quantification of mesenchymal stromal cell/pericyte markers was performed using the CellProfiler image analysis software, and workflows were established for each respective antibody (representative CD146 and CD73 are shown). Fields of view were taken from the original image (Raw) and using the program threshold algorithms DAB stained regions (DAB regions) and nuclei (Nuclei) were defined (colored objects were arbitrarily assigned). Pixel area was determined from the colored segments detected in the DAB regions and nuclei. The images represent individual areas detected with either DAB or nuclei staining. These identified regions were subsequently overlaid on the original field of view to allow for validation (Overlay). x‐ and y‐axes represent pixel co‐ordinates of the original images. Abbreviation: DAB, 3,3′‐diaminobenzidine
